Estimated Value: $922,506 - $1,321,000
4
Beds
3
Baths
2,661
Sq Ft
$397/Sq Ft
Est. Value
About This Home
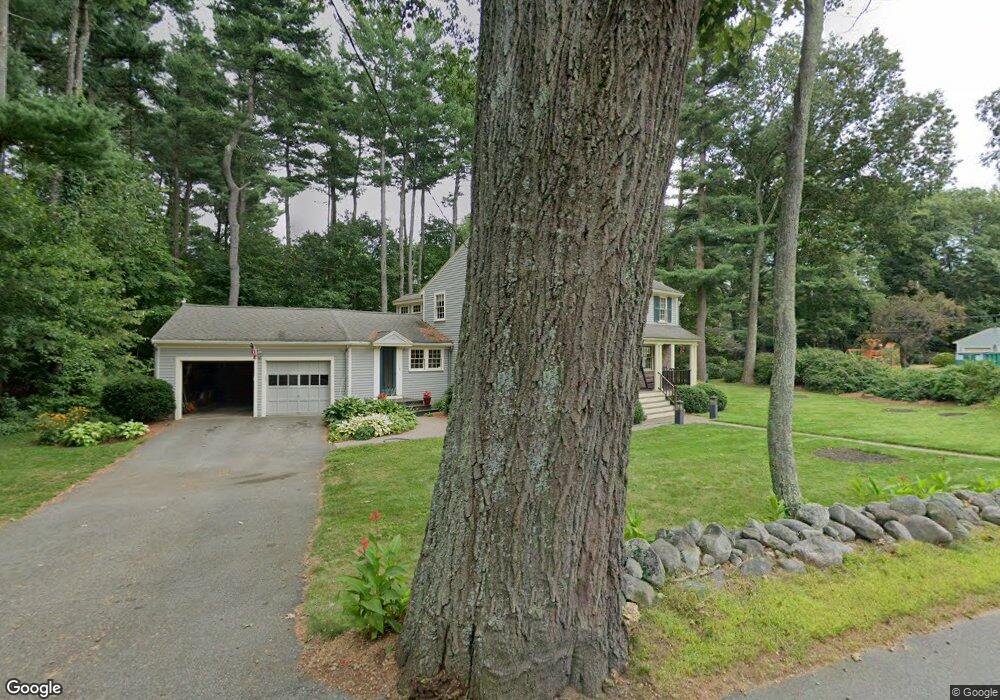
This home is located at 16 Hosmer St, Acton, MA 01720 and is currently estimated at $1,057,377, approximately $397 per square foot. 16 Hosmer St is a home located in Middlesex County with nearby schools including Acton-Boxborough Regional High School and Nashoba Brooks School.
Ownership History
Date
Name
Owned For
Owner Type
Purchase Details
Closed on
Dec 13, 2019
Sold by
Peterman Thomas C and Peterman Suzanne H
Bought by
Suzanne H Peterman T
Current Estimated Value
Purchase Details
Closed on
May 28, 1991
Sold by
Freker Phyllis and John C Freker S
Bought by
Peterman Thomas C and Peterman Suzanne H
Create a Home Valuation Report for This Property
The Home Valuation Report is an in-depth analysis detailing your home's value as well as a comparison with similar homes in the area
Home Values in the Area
Average Home Value in this Area
Purchase History
| Date | Buyer | Sale Price | Title Company |
|---|---|---|---|
| Suzanne H Peterman T | -- | None Available | |
| Peterman Thomas C | $240,000 | -- |
Source: Public Records
Mortgage History
| Date | Status | Borrower | Loan Amount |
|---|---|---|---|
| Previous Owner | Peterman Thomas C | $210,000 | |
| Previous Owner | Peterman Thomas C | $25,000 | |
| Previous Owner | Peterman Thomas C | $181,000 |
Source: Public Records
Tax History
| Year | Tax Paid | Tax Assessment Tax Assessment Total Assessment is a certain percentage of the fair market value that is determined by local assessors to be the total taxable value of land and additions on the property. | Land | Improvement |
|---|---|---|---|---|
| 2025 | $14,202 | $828,100 | $313,700 | $514,400 |
| 2024 | $13,259 | $795,400 | $313,700 | $481,700 |
| 2023 | $12,933 | $736,500 | $285,000 | $451,500 |
| 2022 | $12,232 | $628,900 | $247,900 | $381,000 |
| 2021 | $12,160 | $601,100 | $229,500 | $371,600 |
| 2020 | $11,465 | $595,900 | $229,500 | $366,400 |
| 2019 | $10,965 | $566,100 | $229,500 | $336,600 |
| 2018 | $10,766 | $555,500 | $229,500 | $326,000 |
| 2017 | $10,487 | $550,200 | $229,500 | $320,700 |
| 2016 | $10,275 | $534,300 | $229,500 | $304,800 |
| 2015 | $9,935 | $521,500 | $229,500 | $292,000 |
| 2014 | $9,589 | $493,000 | $229,500 | $263,500 |
Source: Public Records
Map
Nearby Homes
Your Personal Tour Guide
Ask me questions while you tour the home.