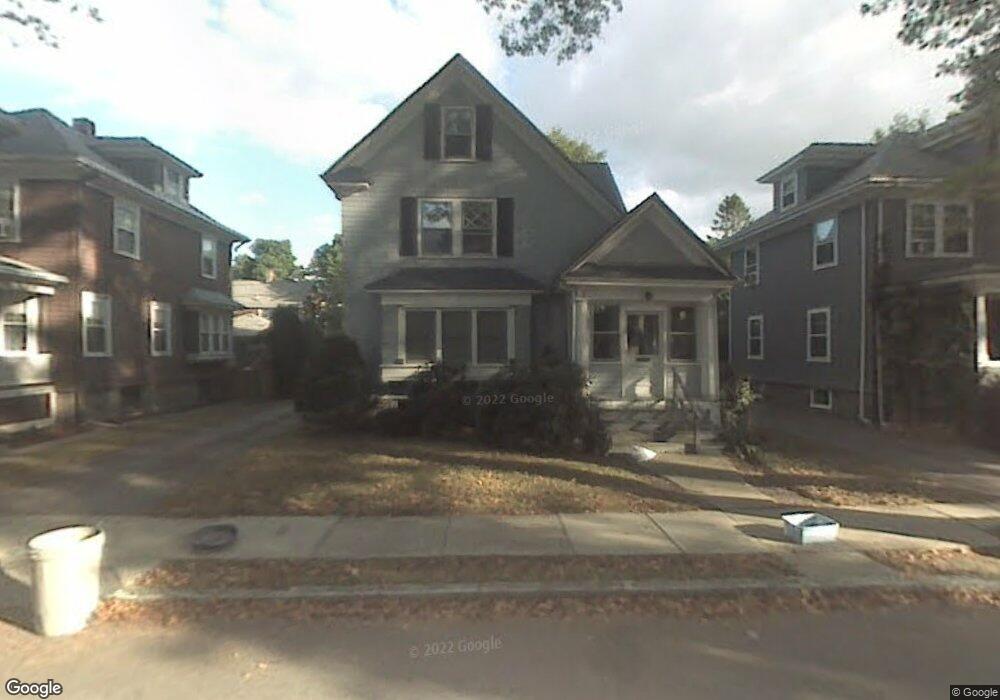
16 Howitt Rd West Roxbury, MA 02132
Bellevue Hill NeighborhoodEstimated Value: $943,716 - $1,196,000
4
Beds
2
Baths
2,160
Sq Ft
$510/Sq Ft
Est. Value
About This Home
This home is located at 16 Howitt Rd, West Roxbury, MA 02132 and is currently estimated at $1,101,179, approximately $509 per square foot. 16 Howitt Rd is a home located in Suffolk County with nearby schools including St Theresa School, Holy Name Parish School, and The Roxbury Latin School.
Ownership History
Date
Name
Owned For
Owner Type
Purchase Details
Closed on
Aug 16, 1994
Sold by
Soalt Arthur and Soalt Adele
Bought by
Gagen Deborah A
Current Estimated Value
Purchase Details
Closed on
Feb 24, 1989
Sold by
Harran John
Bought by
Soalt Arthur
Create a Home Valuation Report for This Property
The Home Valuation Report is an in-depth analysis detailing your home's value as well as a comparison with similar homes in the area
Home Values in the Area
Average Home Value in this Area
Purchase History
| Date | Buyer | Sale Price | Title Company |
|---|---|---|---|
| Gagen Deborah A | $236,000 | -- | |
| Soalt Arthur | $194,500 | -- |
Source: Public Records
Mortgage History
| Date | Status | Borrower | Loan Amount |
|---|---|---|---|
| Open | Soalt Arthur | $75,000 | |
| Closed | Soalt Arthur | $60,000 |
Source: Public Records
Tax History
| Year | Tax Paid | Tax Assessment Tax Assessment Total Assessment is a certain percentage of the fair market value that is determined by local assessors to be the total taxable value of land and additions on the property. | Land | Improvement |
|---|---|---|---|---|
| 2025 | $8,771 | $757,400 | $279,800 | $477,600 |
| 2024 | $8,333 | $764,500 | $298,600 | $465,900 |
| 2023 | $7,746 | $721,200 | $281,700 | $439,500 |
| 2022 | $7,133 | $655,600 | $256,100 | $399,500 |
| 2021 | $6,660 | $624,200 | $248,600 | $375,600 |
| 2020 | $6,280 | $594,700 | $205,200 | $389,500 |
| 2019 | $5,855 | $555,500 | $178,000 | $377,500 |
| 2018 | $5,543 | $528,900 | $178,000 | $350,900 |
| 2017 | $5,686 | $536,900 | $178,000 | $358,900 |
| 2016 | $5,573 | $506,600 | $178,000 | $328,600 |
| 2015 | $5,667 | $468,000 | $153,800 | $314,200 |
| 2014 | $5,497 | $437,000 | $153,800 | $283,200 |
Source: Public Records
Map
Nearby Homes
- 73 Woodard Rd
- 78 Howitt Rd
- 205 Park St Unit 2
- 348 Lagrange St
- 37 Pelton St
- 425 Lagrange St Unit 203
- 17 Hastings St Unit 5
- 4 Anawan Ave Unit 7
- 35 Heron St
- 2231 Centre St
- 17 Starling St
- 16 Starling St
- 24 Rhoda St
- 37 Hastings St Unit 201
- 1721 Centre St Unit 402
- 14 Heron St Unit 14-207
- 14 Heron St Unit 210
- 83 Newburg St Unit 1
- 4925 Washington St Unit 201
- 73 Dent St Unit 2
Your Personal Tour Guide
Ask me questions while you tour the home.