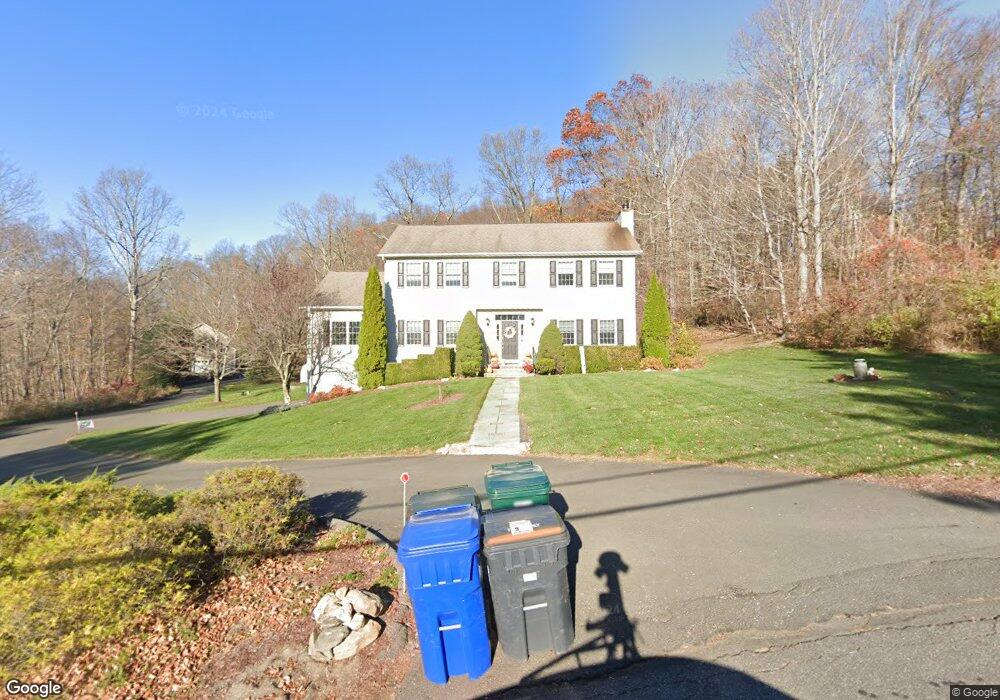
16 Hudson Dr New Fairfield, CT 06812
Estimated Value: $665,432 - $806,000
4
Beds
3
Baths
2,620
Sq Ft
$284/Sq Ft
Est. Value
About This Home
This home is located at 16 Hudson Dr, New Fairfield, CT 06812 and is currently estimated at $744,608, approximately $284 per square foot. 16 Hudson Dr is a home located in Fairfield County with nearby schools including Meeting House Hill School, New Fairfield Middle School, and New Fairfield High School.
Ownership History
Date
Name
Owned For
Owner Type
Purchase Details
Closed on
Jun 21, 2000
Sold by
Realty Seri
Bought by
Cadmus Ii Ray and Cadmus Lori
Current Estimated Value
Purchase Details
Closed on
Nov 24, 1999
Sold by
Seri Rlty 2 Llc
Bought by
Aragones John S and Aragones Mary T
Purchase Details
Closed on
Mar 25, 1999
Sold by
Kaiser John
Bought by
Seri Rlty Llc
Create a Home Valuation Report for This Property
The Home Valuation Report is an in-depth analysis detailing your home's value as well as a comparison with similar homes in the area
Home Values in the Area
Average Home Value in this Area
Purchase History
| Date | Buyer | Sale Price | Title Company |
|---|---|---|---|
| Cadmus Ii Ray | $327,000 | -- | |
| Aragones John S | $328,000 | -- | |
| Seri Rlty Llc | $85,000 | -- |
Source: Public Records
Mortgage History
| Date | Status | Borrower | Loan Amount |
|---|---|---|---|
| Open | Seri Rlty Llc | $30,000 | |
| Open | Seri Rlty Llc | $229,000 | |
| Closed | Seri Rlty Llc | $231,548 |
Source: Public Records
Tax History Compared to Growth
Tax History
| Year | Tax Paid | Tax Assessment Tax Assessment Total Assessment is a certain percentage of the fair market value that is determined by local assessors to be the total taxable value of land and additions on the property. | Land | Improvement |
|---|---|---|---|---|
| 2025 | $9,774 | $371,200 | $113,000 | $258,200 |
| 2024 | $9,667 | $264,700 | $102,200 | $162,500 |
| 2023 | $9,238 | $264,700 | $102,200 | $162,500 |
| 2022 | $8,595 | $264,700 | $102,200 | $162,500 |
| 2021 | $8,335 | $264,700 | $102,200 | $162,500 |
| 2020 | $8,095 | $264,700 | $102,200 | $162,500 |
| 2019 | $7,734 | $250,300 | $102,200 | $148,100 |
| 2018 | $7,654 | $250,300 | $102,200 | $148,100 |
| 2017 | $7,464 | $250,300 | $102,200 | $148,100 |
| 2016 | $7,179 | $250,300 | $102,200 | $148,100 |
| 2015 | $7,141 | $250,300 | $102,200 | $148,100 |
| 2014 | $7,480 | $286,800 | $107,000 | $179,800 |
Source: Public Records
Map
Nearby Homes