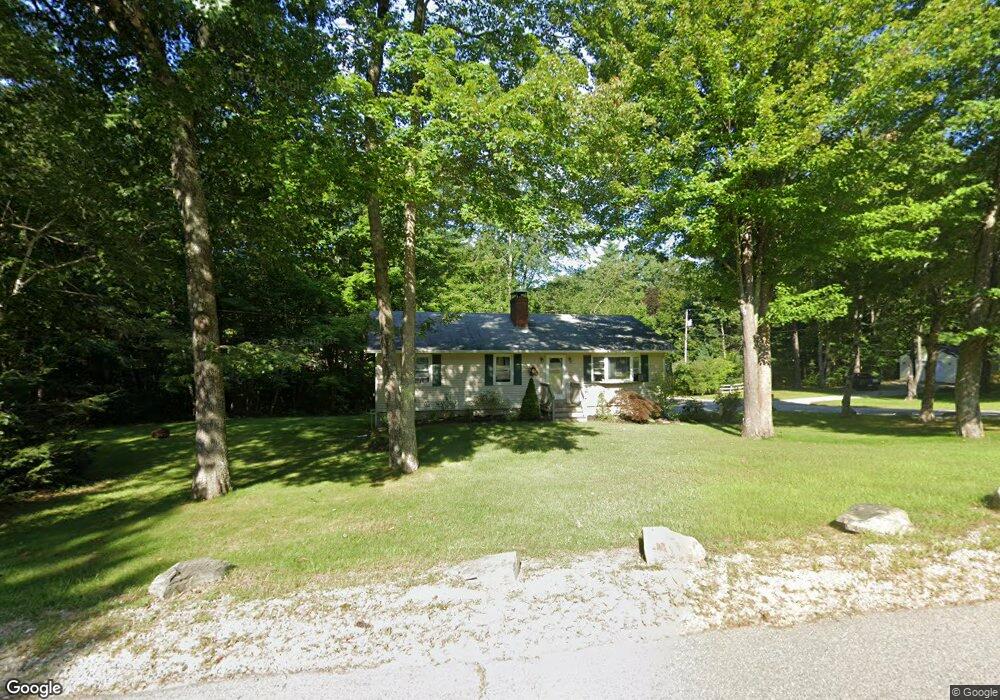
16 Hunter Dr Epping, NH 03042
Estimated Value: $466,175 - $516,000
3
Beds
2
Baths
1,518
Sq Ft
$325/Sq Ft
Est. Value
About This Home
This home is located at 16 Hunter Dr, Epping, NH 03042 and is currently estimated at $493,544, approximately $325 per square foot. 16 Hunter Dr is a home located in Rockingham County with nearby schools including Epping Elementary School, Epping Middle School, and Epping High School.
Ownership History
Date
Name
Owned For
Owner Type
Purchase Details
Closed on
Dec 2, 2009
Sold by
Moule James C and Moule Lindy L
Bought by
Cash Edward and Cash Judith M
Current Estimated Value
Home Financials for this Owner
Home Financials are based on the most recent Mortgage that was taken out on this home.
Original Mortgage
$218,960
Outstanding Balance
$143,622
Interest Rate
5.01%
Mortgage Type
Purchase Money Mortgage
Estimated Equity
$349,922
Purchase Details
Closed on
Nov 8, 1999
Sold by
Seaman Cynthia D and Seaman Charles K
Bought by
Moule Lindy L and Moule James C
Home Financials for this Owner
Home Financials are based on the most recent Mortgage that was taken out on this home.
Original Mortgage
$70,000
Interest Rate
7.73%
Create a Home Valuation Report for This Property
The Home Valuation Report is an in-depth analysis detailing your home's value as well as a comparison with similar homes in the area
Home Values in the Area
Average Home Value in this Area
Purchase History
| Date | Buyer | Sale Price | Title Company |
|---|---|---|---|
| Cash Edward | $223,000 | -- | |
| Moule Lindy L | $141,900 | -- |
Source: Public Records
Mortgage History
| Date | Status | Borrower | Loan Amount |
|---|---|---|---|
| Open | Moule Lindy L | $218,960 | |
| Previous Owner | Moule Lindy L | $70,000 |
Source: Public Records
Tax History
| Year | Tax Paid | Tax Assessment Tax Assessment Total Assessment is a certain percentage of the fair market value that is determined by local assessors to be the total taxable value of land and additions on the property. | Land | Improvement |
|---|---|---|---|---|
| 2025 | $6,696 | $446,400 | $189,300 | $257,100 |
| 2024 | $7,029 | $278,600 | $108,800 | $169,800 |
| 2023 | $6,519 | $278,600 | $108,800 | $169,800 |
| 2022 | $6,140 | $273,000 | $108,800 | $164,200 |
| 2021 | $6,121 | $273,000 | $108,800 | $164,200 |
| 2020 | $6,454 | $273,000 | $108,800 | $164,200 |
| 2019 | $5,936 | $214,300 | $86,200 | $128,100 |
| 2018 | $5,559 | $214,300 | $86,200 | $128,100 |
| 2017 | $5,559 | $214,300 | $86,200 | $128,100 |
| 2016 | $5,559 | $214,300 | $86,200 | $128,100 |
| 2015 | $5,559 | $214,300 | $86,200 | $128,100 |
| 2014 | $5,165 | $211,500 | $86,200 | $125,300 |
| 2013 | $5,133 | $211,500 | $86,200 | $125,300 |
Source: Public Records
Map
Nearby Homes
Your Personal Tour Guide
Ask me questions while you tour the home.