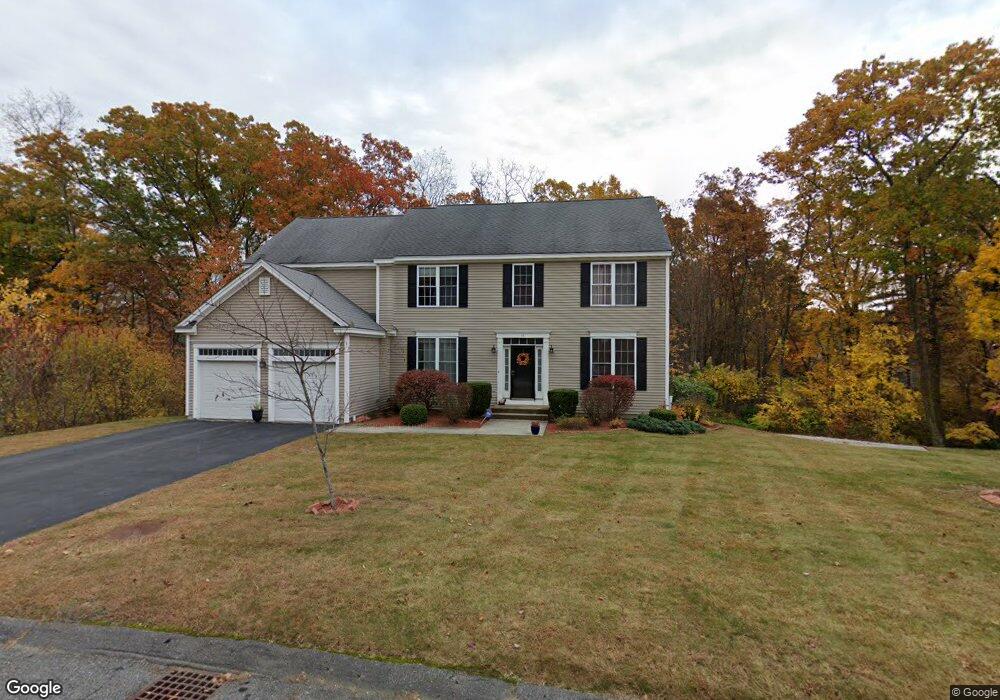
16 Independence Ln Ashland, MA 01721
Estimated Value: $1,070,854 - $1,289,000
4
Beds
3
Baths
2,944
Sq Ft
$398/Sq Ft
Est. Value
About This Home
This home is located at 16 Independence Ln, Ashland, MA 01721 and is currently estimated at $1,170,964, approximately $397 per square foot. 16 Independence Ln is a home located in Middlesex County with nearby schools including William Pittaway Elementary School, David Mindess Elementary School, and Henry E. Warren Elementary School.
Ownership History
Date
Name
Owned For
Owner Type
Purchase Details
Closed on
Dec 20, 2011
Sold by
Boynton Richard and Boynton Lori
Bought by
Singh Prag B
Current Estimated Value
Home Financials for this Owner
Home Financials are based on the most recent Mortgage that was taken out on this home.
Original Mortgage
$462,958
Outstanding Balance
$312,715
Interest Rate
3.75%
Mortgage Type
FHA
Estimated Equity
$858,249
Purchase Details
Closed on
Feb 6, 2008
Sold by
Harpham Brent G and Brook Jennifer L
Bought by
Boynton Lori and Boynton Richard
Home Financials for this Owner
Home Financials are based on the most recent Mortgage that was taken out on this home.
Original Mortgage
$150,000
Interest Rate
6.2%
Mortgage Type
Purchase Money Mortgage
Purchase Details
Closed on
Mar 28, 2003
Sold by
Scoville John H and Scoville Mary R
Bought by
Harpham Brent G and Brook Jennifer L
Home Financials for this Owner
Home Financials are based on the most recent Mortgage that was taken out on this home.
Original Mortgage
$423,200
Interest Rate
5.91%
Mortgage Type
Purchase Money Mortgage
Create a Home Valuation Report for This Property
The Home Valuation Report is an in-depth analysis detailing your home's value as well as a comparison with similar homes in the area
Home Values in the Area
Average Home Value in this Area
Purchase History
| Date | Buyer | Sale Price | Title Company |
|---|---|---|---|
| Singh Prag B | $475,000 | -- | |
| Boynton Lori | $538,000 | -- | |
| Harpham Brent G | $529,000 | -- | |
| Singh Prag B | $475,000 | -- | |
| Boynton Lori | $538,000 | -- | |
| Harpham Brent G | $529,000 | -- |
Source: Public Records
Mortgage History
| Date | Status | Borrower | Loan Amount |
|---|---|---|---|
| Open | Singh Prag B | $462,958 | |
| Closed | Harpham Brent G | $462,958 | |
| Previous Owner | Boynton Lori | $150,000 | |
| Previous Owner | Harpham Brent G | $423,200 |
Source: Public Records
Tax History
| Year | Tax Paid | Tax Assessment Tax Assessment Total Assessment is a certain percentage of the fair market value that is determined by local assessors to be the total taxable value of land and additions on the property. | Land | Improvement |
|---|---|---|---|---|
| 2025 | $12,964 | $1,015,200 | $273,800 | $741,400 |
| 2024 | $12,427 | $938,600 | $273,800 | $664,800 |
| 2023 | $11,391 | $827,200 | $261,300 | $565,900 |
| 2022 | $11,462 | $721,800 | $235,500 | $486,300 |
| 2021 | $11,016 | $691,500 | $235,500 | $456,000 |
| 2020 | $10,840 | $670,800 | $239,100 | $431,700 |
| 2019 | $9,714 | $596,700 | $239,100 | $357,600 |
| 2018 | $9,862 | $580,600 | $237,100 | $343,500 |
| 2017 | $9,420 | $564,100 | $237,100 | $327,000 |
| 2016 | $9,185 | $540,300 | $237,100 | $303,200 |
| 2015 | $8,910 | $515,000 | $223,800 | $291,200 |
| 2014 | $8,679 | $499,100 | $208,900 | $290,200 |
Source: Public Records
Map
Nearby Homes
- 20 Vine St
- 0 Oak St
- 9 Garrison Ln
- 0 Oregon Rd
- 7 Carolyn Terrace
- 47 Central St
- 10 Lorenzo Dr
- 216 Boston Rd
- 55 Southville Rd
- 66 Cedar Hill Rd
- 9A Ashley Rd
- 1 Carriage Hill Cir Unit 1
- 7 Thomas Dr
- 20 Southville Rd
- 203 Pleasant St
- 24 Meadow Ln
- 26 Meadow Ln
- 3 Leonard Dr
- 24 Russet Hill Rd
- 96 Pleasant St Unit 96
- 20 Independence Ln
- 15 Independence Ln
- 17 Independence Ln
- 11 Independence Ln
- 24 Independence Ln
- 23 Independence Ln
- 7 Independence Ln
- 7 Whippoorwill Ln
- 11 Whippoorwill Ln
- 244 Oak St
- 222 Oak St
- 224 Oak St
- 27 Independence Ln
- 28 Independence Ln
- 3 Whippoorwill Ln
- 31 Independence Ln
- 216 Oak St
- 221 Oak St
- 248 Oak St
- 14 Whippoorwill Ln
Your Personal Tour Guide
Ask me questions while you tour the home.