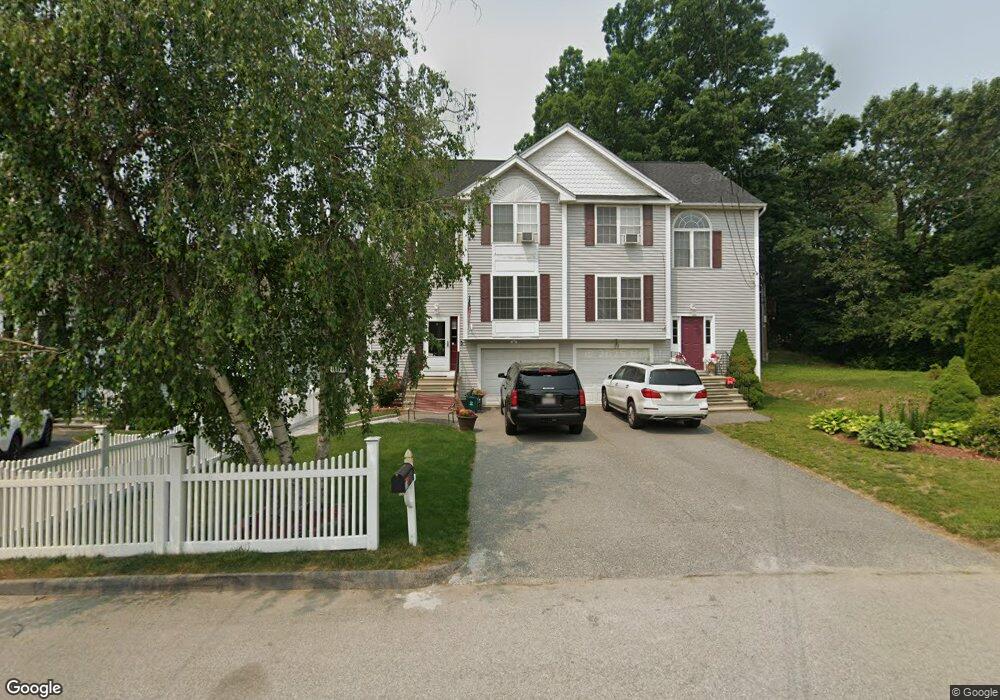
16 Inverness Ave Worcester, MA 01604
Grafton Hill NeighborhoodEstimated Value: $411,000 - $442,000
3
Beds
2
Baths
1,588
Sq Ft
$267/Sq Ft
Est. Value
About This Home
This home is located at 16 Inverness Ave, Worcester, MA 01604 and is currently estimated at $423,395, approximately $266 per square foot. 16 Inverness Ave is a home located in Worcester County with nearby schools including Jacob Hiatt Magnet School, Chandler Magnet, and Rice Square Elementary School.
Ownership History
Date
Name
Owned For
Owner Type
Purchase Details
Closed on
Mar 10, 1998
Sold by
Harrington Thomas
Bought by
Corso Stephen A and Corso Karen M
Current Estimated Value
Purchase Details
Closed on
Oct 30, 1997
Sold by
Rynearson Daivd and Rynearson Kelly
Bought by
Harrington 2N Thomas P
Create a Home Valuation Report for This Property
The Home Valuation Report is an in-depth analysis detailing your home's value as well as a comparison with similar homes in the area
Home Values in the Area
Average Home Value in this Area
Purchase History
| Date | Buyer | Sale Price | Title Company |
|---|---|---|---|
| Corso Stephen A | $109,900 | -- | |
| Harrington 2N Thomas P | $20,000 | -- |
Source: Public Records
Mortgage History
| Date | Status | Borrower | Loan Amount |
|---|---|---|---|
| Open | Harrington 2N Thomas P | $152,000 | |
| Closed | Harrington 2N Thomas P | $104,094 | |
| Closed | Harrington 2N Thomas P | $23,659 |
Source: Public Records
Tax History
| Year | Tax Paid | Tax Assessment Tax Assessment Total Assessment is a certain percentage of the fair market value that is determined by local assessors to be the total taxable value of land and additions on the property. | Land | Improvement |
|---|---|---|---|---|
| 2025 | $4,858 | $368,300 | $77,500 | $290,800 |
| 2024 | $4,586 | $333,500 | $77,500 | $256,000 |
| 2023 | $4,404 | $307,100 | $67,400 | $239,700 |
| 2022 | $3,979 | $261,600 | $53,900 | $207,700 |
| 2021 | $3,876 | $238,100 | $43,100 | $195,000 |
| 2020 | $3,771 | $221,800 | $43,100 | $178,700 |
| 2019 | $3,631 | $201,700 | $38,800 | $162,900 |
| 2018 | $3,619 | $191,400 | $38,800 | $152,600 |
| 2017 | $3,413 | $177,600 | $38,800 | $138,800 |
| 2016 | $3,413 | $165,600 | $29,800 | $135,800 |
| 2015 | $3,324 | $165,600 | $29,800 | $135,800 |
| 2014 | $3,236 | $165,600 | $29,800 | $135,800 |
Source: Public Records
Map
Nearby Homes
- 143 Dorcester
- 16 Arborwood Dr
- 80 Delmont Ave
- 83 Massasoit Rd
- 10 County St
- 155 Hamilton St Unit 4
- 12 Benham St
- 62 Allston Ave
- 68 Dartmouth St
- 20 Brightwood Ave
- 429 Grafton St Unit 2
- 360 Hamilton St
- 21 Middlesex Ave Unit 102
- 53 Denver Terrace
- Lot B Crawford St
- 34 Robin Rd
- 143 Commonwealth Ave
- 19 Middlesex Ave
- 24 Ingleside Ave
- 15 Houghton St Unit 9
- 18 Inverness Ave
- 18 Inverness Ave Unit 1
- 113 Warner Ave
- 111 Warner Ave
- 111 Warner Ave Unit 1
- 14 Inverness Ave
- 117 Warner Ave
- 121 Warner Ave
- 101 Warner Ave
- 125 Warner Ave
- 22 Inverness Ave Unit 2D
- 22 Inverness Ave Unit 2C
- 22 Inverness Ave Unit 2B
- 22 Inverness Ave Unit 2A
- 22 Inverness Ave Unit 1D
- 22 Inverness Ave Unit 1C
- 22 Inverness Ave Unit 1B
- 22 Inverness Ave Unit 1A
- 22 Inverness Ave Unit 22 1B
- 22 Inverness Ave Unit 22
Your Personal Tour Guide
Ask me questions while you tour the home.