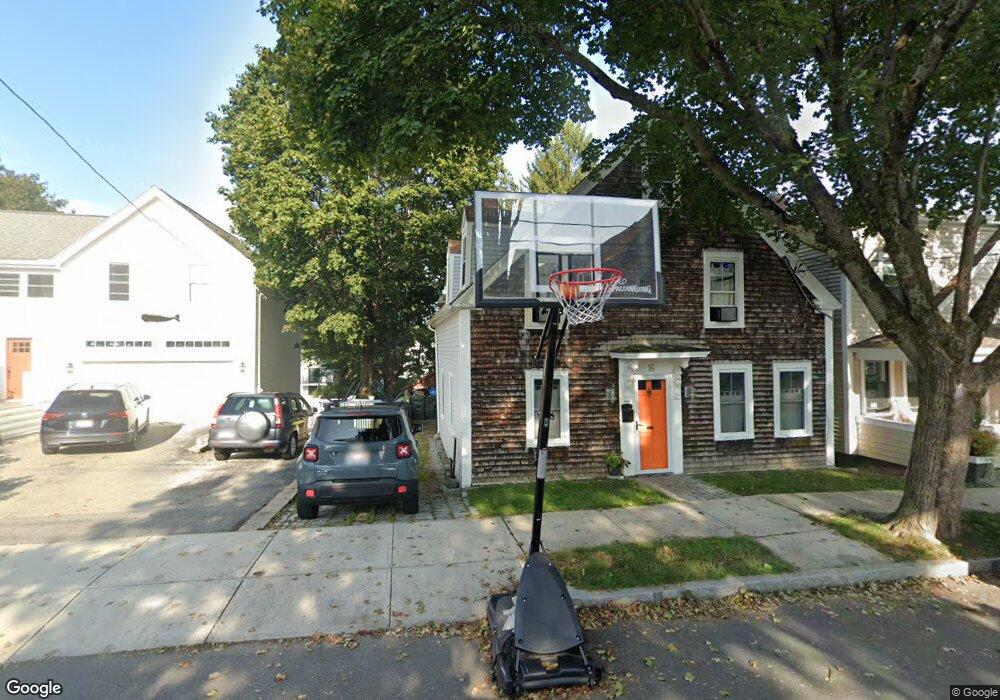
16 Jackson St Newburyport, MA 01950
Estimated Value: $1,078,000 - $1,156,000
4
Beds
3
Baths
2,050
Sq Ft
$550/Sq Ft
Est. Value
About This Home
This home is located at 16 Jackson St, Newburyport, MA 01950 and is currently estimated at $1,126,799, approximately $549 per square foot. 16 Jackson St is a home located in Essex County with nearby schools including Francis T. Bresnahan Elementary School, Edward G. Molin Elementary School, and Rupert A. Nock Middle School.
Ownership History
Date
Name
Owned For
Owner Type
Purchase Details
Closed on
Nov 18, 2009
Sold by
Stanwood Paul W and Stanwood Harriett A
Bought by
Stanwood Amy G
Current Estimated Value
Purchase Details
Closed on
Apr 2, 2003
Sold by
Stanwood Harriett A and Stanwood Paul W
Bought by
Stanwood Amy G
Create a Home Valuation Report for This Property
The Home Valuation Report is an in-depth analysis detailing your home's value as well as a comparison with similar homes in the area
Home Values in the Area
Average Home Value in this Area
Purchase History
| Date | Buyer | Sale Price | Title Company |
|---|---|---|---|
| Stanwood Amy G | -- | -- | |
| Stanwood Amy G | -- | -- |
Source: Public Records
Mortgage History
| Date | Status | Borrower | Loan Amount |
|---|---|---|---|
| Open | Stanwood Amy G | $150,000 | |
| Open | Stanwood Amy G | $396,300 |
Source: Public Records
Tax History Compared to Growth
Tax History
| Year | Tax Paid | Tax Assessment Tax Assessment Total Assessment is a certain percentage of the fair market value that is determined by local assessors to be the total taxable value of land and additions on the property. | Land | Improvement |
|---|---|---|---|---|
| 2025 | $8,670 | $905,000 | $368,900 | $536,100 |
| 2024 | $8,222 | $824,700 | $335,300 | $489,400 |
| 2023 | $8,388 | $781,000 | $291,600 | $489,400 |
| 2022 | $7,922 | $659,600 | $243,000 | $416,600 |
| 2021 | $7,576 | $599,400 | $220,900 | $378,500 |
| 2020 | $7,479 | $582,500 | $220,900 | $361,600 |
| 2019 | $7,274 | $556,100 | $220,900 | $335,200 |
| 2018 | $7,034 | $530,500 | $210,400 | $320,100 |
| 2017 | $6,874 | $511,100 | $200,400 | $310,700 |
| 2016 | $6,363 | $475,200 | $190,800 | $284,400 |
| 2015 | $5,808 | $435,400 | $190,800 | $244,600 |
Source: Public Records
Map
Nearby Homes
- 288 Merrimac St
- 13 Broad St
- 217 Merrimac St Unit 1
- 266 Merrimac St Unit F
- 27 Warren St Unit 1
- 287 1/2 High St
- 158 Merrimac St Unit 3
- 126 Merrimac St Unit 35
- 126 Merrimac St Unit 31
- 45 Boardman St Unit 1
- 41 Washington St Unit B
- 44 Washington St Unit C
- 14 Dexter Ln Unit B
- 14 Dexter Ln Unit A
- 138 Low St
- 110 Low St
- 19 Jefferson St
- 1 Jefferson St
- 58 Merrimac St Unit 2-5
- 175 Bridge Rd