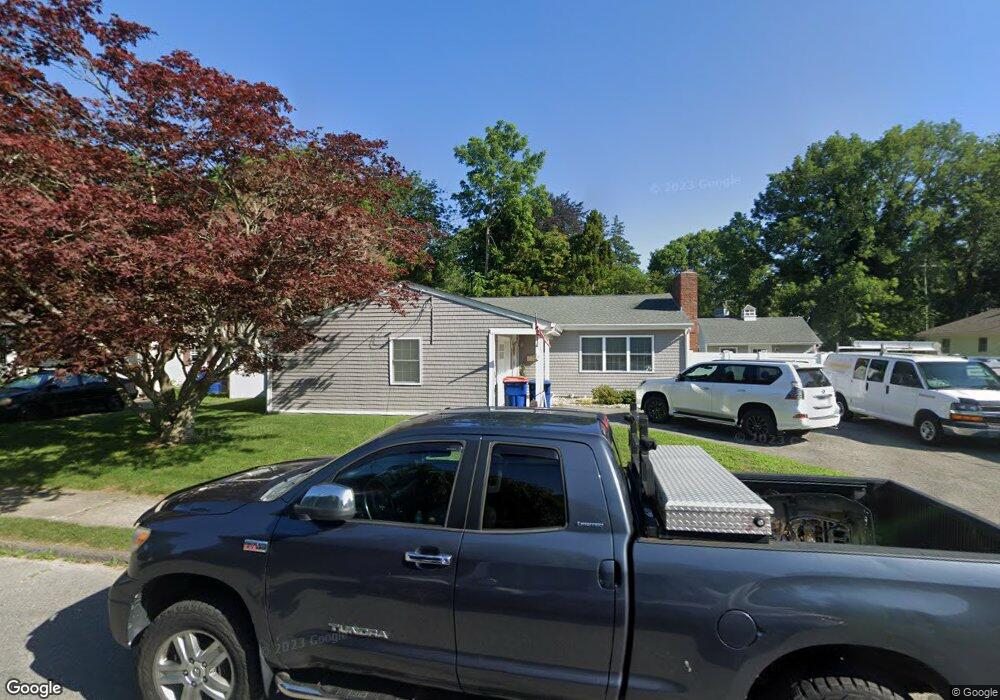
16 Jarvis Ave Fairhaven, MA 02719
Oxford NeighborhoodEstimated Value: $479,000 - $588,000
2
Beds
2
Baths
1,467
Sq Ft
$362/Sq Ft
Est. Value
About This Home
This home is located at 16 Jarvis Ave, Fairhaven, MA 02719 and is currently estimated at $531,280, approximately $362 per square foot. 16 Jarvis Ave is a home located in Bristol County with nearby schools including Fairhaven High School, Alma Del Mar Charter School, and City On A Hill Charter Public School New Bedford.
Ownership History
Date
Name
Owned For
Owner Type
Purchase Details
Closed on
Apr 11, 2016
Sold by
Lessa Jason M and Barton Paul L
Bought by
Lessa Jason M and Lessa Alyssa B
Current Estimated Value
Home Financials for this Owner
Home Financials are based on the most recent Mortgage that was taken out on this home.
Original Mortgage
$57,000
Interest Rate
3.59%
Mortgage Type
Unknown
Purchase Details
Closed on
Apr 1, 2015
Sold by
Blanchette Karen A and Gamache Ann Marie
Bought by
Lessa Jason M and Barton Paul L
Create a Home Valuation Report for This Property
The Home Valuation Report is an in-depth analysis detailing your home's value as well as a comparison with similar homes in the area
Home Values in the Area
Average Home Value in this Area
Purchase History
| Date | Buyer | Sale Price | Title Company |
|---|---|---|---|
| Lessa Jason M | -- | -- | |
| Lessa Jason M | $110,000 | -- |
Source: Public Records
Mortgage History
| Date | Status | Borrower | Loan Amount |
|---|---|---|---|
| Open | Lessa Alysa A | $215,000 | |
| Closed | Lessa Jason M | $120,000 | |
| Closed | Lessa Jason M | $57,000 | |
| Closed | Lessa Jason M | $180,000 | |
| Previous Owner | Defreitas Abilio F | $53,500 | |
| Previous Owner | Defreitas Abilio F | $55,000 |
Source: Public Records
Tax History
| Year | Tax Paid | Tax Assessment Tax Assessment Total Assessment is a certain percentage of the fair market value that is determined by local assessors to be the total taxable value of land and additions on the property. | Land | Improvement |
|---|---|---|---|---|
| 2025 | $41 | $436,700 | $186,800 | $249,900 |
| 2024 | $3,748 | $406,100 | $186,800 | $219,300 |
| 2023 | $3,690 | $370,900 | $173,100 | $197,800 |
| 2022 | $3,533 | $345,700 | $164,900 | $180,800 |
| 2021 | $2,984 | $264,300 | $149,900 | $114,400 |
| 2020 | $3,559 | $257,500 | $143,100 | $114,400 |
| 2019 | $2,828 | $242,300 | $130,300 | $112,000 |
| 2018 | $3,370 | $231,600 | $124,000 | $107,600 |
| 2017 | $2,735 | $227,200 | $124,000 | $103,200 |
| 2016 | $2,706 | $222,200 | $124,000 | $98,200 |
| 2015 | $2,684 | $220,900 | $124,000 | $96,900 |
Source: Public Records
Map
Nearby Homes
- 61 Oxford St
- 442 Dana Farms
- 24 Academy Ave
- 15 School St
- 313 Main St
- 16 Ash St
- 253 Adams St
- 14 Sycamore St
- 48 Bellevue St
- 10 Livesey Pkwy
- 138 Main St Unit 13
- 67 Bridge St
- 39 Christian St
- 71 Sycamore St
- 77 Adams St
- 13 Hawthorne St
- 145 Pleasant St
- 0 Nulands Neck Unit 73286360
- 58 Washington St
- 7 Deerfield Ln
Your Personal Tour Guide
Ask me questions while you tour the home.