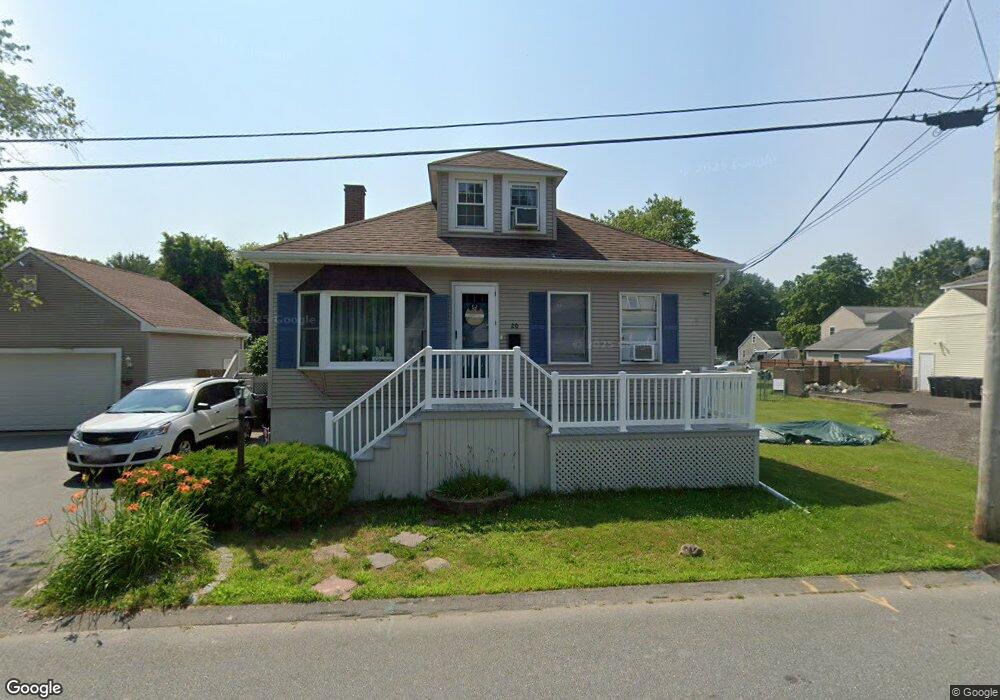
16 Johnson St North Dartmouth, MA 02747
North Dartmouth NeighborhoodEstimated Value: $542,461 - $730,000
3
Beds
2
Baths
1,906
Sq Ft
$331/Sq Ft
Est. Value
About This Home
This home is located at 16 Johnson St, North Dartmouth, MA 02747 and is currently estimated at $630,365, approximately $330 per square foot. 16 Johnson St is a home located in Bristol County with nearby schools including Dartmouth High School, Nazarene Christian Academy, and Our Sister's School.
Ownership History
Date
Name
Owned For
Owner Type
Purchase Details
Closed on
May 24, 2013
Sold by
Bindas Valentyna
Bought by
16 Johnson Street Nt
Current Estimated Value
Purchase Details
Closed on
Mar 20, 2012
Sold by
Valentyna Bindas Ret
Bought by
Bindas Valentyna
Purchase Details
Closed on
Apr 20, 2006
Sold by
Bindas Valentyna E
Bought by
Valentyna Bindas Ret
Purchase Details
Closed on
Jun 18, 1965
Bought by
Bindas Valentyna
Create a Home Valuation Report for This Property
The Home Valuation Report is an in-depth analysis detailing your home's value as well as a comparison with similar homes in the area
Home Values in the Area
Average Home Value in this Area
Purchase History
| Date | Buyer | Sale Price | Title Company |
|---|---|---|---|
| 16 Johnson Street Nt | -- | -- | |
| Bindas Valentyna | -- | -- | |
| Bindas Valentyna | -- | -- | |
| Valentyna Bindas Ret | -- | -- | |
| Bindas Valentyna | -- | -- |
Source: Public Records
Mortgage History
| Date | Status | Borrower | Loan Amount |
|---|---|---|---|
| Previous Owner | Bindas Valentyna | $16,614 | |
| Previous Owner | Bindas Valentyna | $100,000 |
Source: Public Records
Tax History Compared to Growth
Tax History
| Year | Tax Paid | Tax Assessment Tax Assessment Total Assessment is a certain percentage of the fair market value that is determined by local assessors to be the total taxable value of land and additions on the property. | Land | Improvement |
|---|---|---|---|---|
| 2025 | $4,467 | $493,600 | $167,200 | $326,400 |
| 2024 | $4,352 | $476,100 | $159,500 | $316,600 |
| 2023 | $4,255 | $439,100 | $147,900 | $291,200 |
| 2022 | $4,058 | $391,700 | $141,500 | $250,200 |
| 2021 | $3,866 | $357,000 | $124,900 | $232,100 |
| 2020 | $3,672 | $337,500 | $124,900 | $212,600 |
| 2019 | $3,629 | $334,500 | $124,900 | $209,600 |
| 2018 | $3,233 | $304,400 | $124,900 | $179,500 |
| 2017 | $3,085 | $289,900 | $117,900 | $172,000 |
| 2016 | $3,048 | $288,100 | $117,900 | $170,200 |
| 2015 | $2,969 | $282,500 | $110,200 | $172,300 |
| 2014 | $2,801 | $268,300 | $100,000 | $168,300 |
Source: Public Records
Map
Nearby Homes
- 40 Golf St
- 35 Suffolk Ave
- 0 Middlesex St
- 0 Norfolk Ave Unit 73403282
- 968 Geraldine St Unit 1A
- 295 Commonwealth Ave
- 1 Spring Hill Rd
- 805 Hathaway Rd Unit 809
- 1406 Tucker Rd
- 50 Gaywood St
- 35 Jenny Lind St
- 46 Old Westport Rd
- 1338 Rockdale Ave
- 469 Hillman St
- ) Hapwell & Summit St
- 6 Strathmore Rd
- 124 Francis St
- 0 Undisclosed Unit 73376281
- 0 Victoria St Unit 73457953
- 24 Wayne Memorial Dr