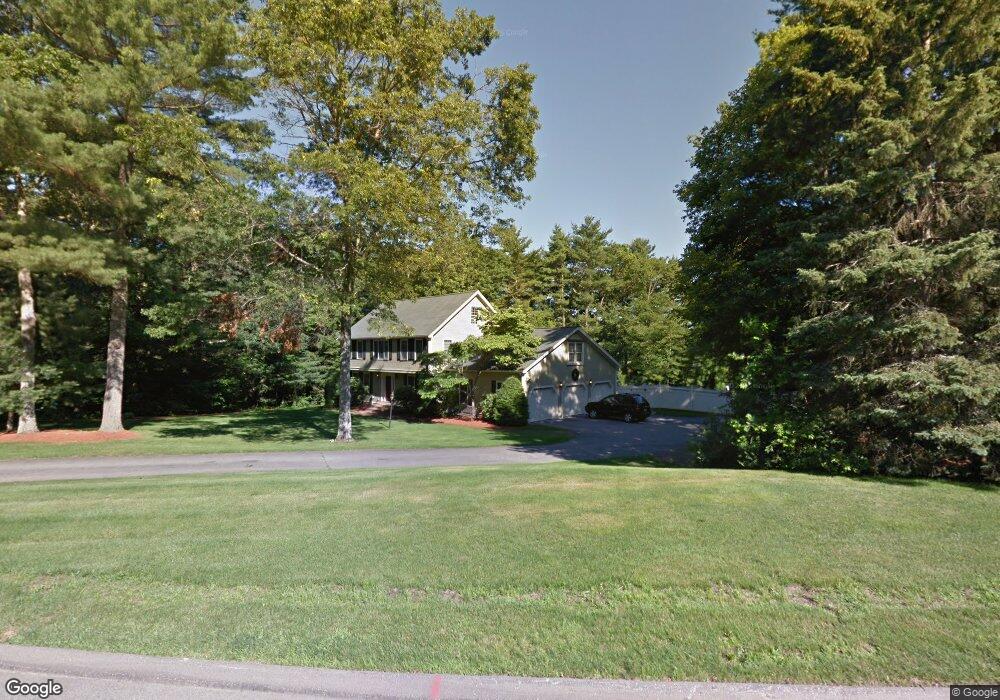
16 Jorie Ln Walpole, MA 02081
Estimated Value: $1,087,000 - $1,275,000
4
Beds
3
Baths
3,259
Sq Ft
$370/Sq Ft
Est. Value
About This Home
This home is located at 16 Jorie Ln, Walpole, MA 02081 and is currently estimated at $1,205,081, approximately $369 per square foot. 16 Jorie Ln is a home located in Norfolk County with nearby schools including Elm Street School, Eleanor N. Johnson Middle School, and Walpole High School.
Ownership History
Date
Name
Owned For
Owner Type
Purchase Details
Closed on
Apr 11, 2018
Sold by
Douglas Victoria R
Bought by
Douglas Nt 2018
Current Estimated Value
Purchase Details
Closed on
Jun 27, 2006
Sold by
Douglas John B and Douglas Victoria R
Bought by
Douglas Victoria R
Create a Home Valuation Report for This Property
The Home Valuation Report is an in-depth analysis detailing your home's value as well as a comparison with similar homes in the area
Home Values in the Area
Average Home Value in this Area
Purchase History
| Date | Buyer | Sale Price | Title Company |
|---|---|---|---|
| Douglas Nt 2018 | -- | -- | |
| Douglas Victoria R | -- | -- |
Source: Public Records
Tax History
| Year | Tax Paid | Tax Assessment Tax Assessment Total Assessment is a certain percentage of the fair market value that is determined by local assessors to be the total taxable value of land and additions on the property. | Land | Improvement |
|---|---|---|---|---|
| 2025 | $14,699 | $1,145,700 | $408,500 | $737,200 |
| 2024 | $14,171 | $1,071,900 | $392,800 | $679,100 |
| 2023 | $13,073 | $941,200 | $341,500 | $599,700 |
| 2022 | $12,025 | $831,600 | $316,200 | $515,400 |
| 2021 | $11,825 | $796,800 | $298,300 | $498,500 |
| 2020 | $11,120 | $741,800 | $281,300 | $460,500 |
| 2019 | $10,775 | $713,600 | $270,400 | $443,200 |
| 2018 | $10,860 | $711,200 | $260,300 | $450,900 |
| 2017 | $10,569 | $689,400 | $250,300 | $439,100 |
| 2016 | $10,291 | $661,400 | $243,100 | $418,300 |
| 2015 | $10,021 | $638,300 | $231,800 | $406,500 |
| 2014 | $9,696 | $615,200 | $231,800 | $383,400 |
Source: Public Records
Map
Nearby Homes
- 115 High St
- 19 and 23 Arlington Ln
- 260 Elm St
- 26 Dover Dr
- 111 Elm St
- 15 Homestead Dr
- 56 North St
- 881 Main St Unit 9
- 6 Litchfields Way
- 26 Drake Cir
- 20 Forrest Rd
- 31 Sandtrap Cir Unit 500
- 10 Sandtrap Cir Unit 2
- 25 Sandtrap Cir Unit 8
- 29 Sandtrap Cir Unit 6
- 27 Sandtrap Cir Unit 7
- 21 Sandtrap Cir Unit 10
- 23 Sandtrap Cir Unit 9
- 27 Sandtrip Cir Unit 7
- 1110 Main St
Your Personal Tour Guide
Ask me questions while you tour the home.