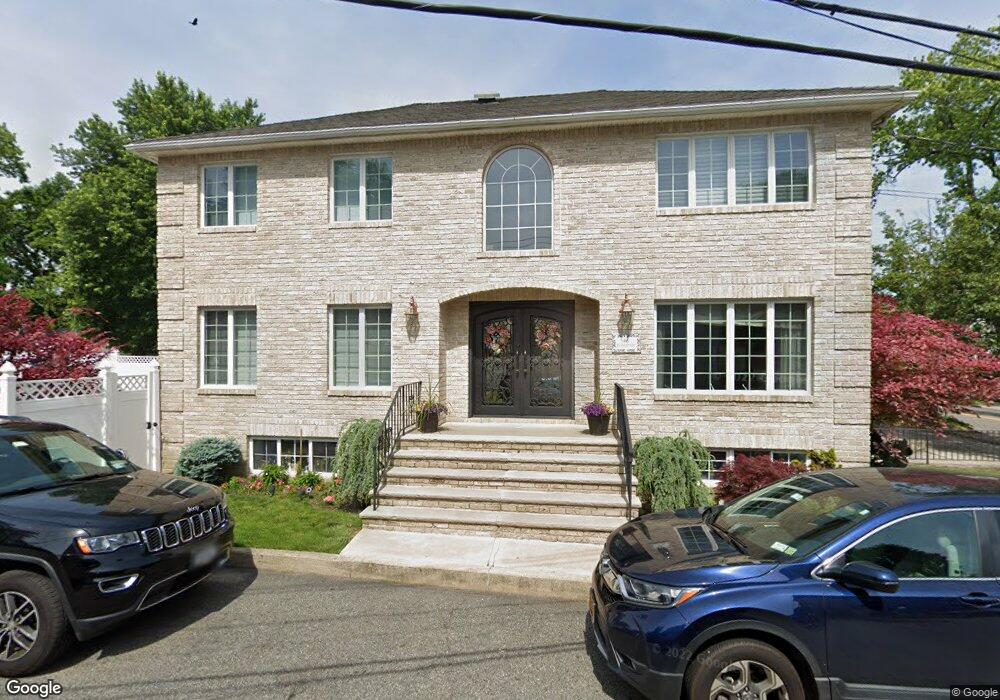
16 Joshua Ct Staten Island, NY 10306
Great Kills NeighborhoodEstimated Value: $800,730 - $1,044,000
--
Bed
4
Baths
1,850
Sq Ft
$500/Sq Ft
Est. Value
About This Home
This home is located at 16 Joshua Ct, Staten Island, NY 10306 and is currently estimated at $924,433, approximately $499 per square foot. 16 Joshua Ct is a home located in Richmond County with nearby schools including P.S. 23 Richmondtown, Myra S. Barnes Intermediate School 24, and Susan E Wagner High School.
Ownership History
Date
Name
Owned For
Owner Type
Purchase Details
Closed on
Jun 7, 2001
Sold by
Rand Marc Homes Ltd
Bought by
Giordano Paul M and Giordano Alfonsina
Current Estimated Value
Home Financials for this Owner
Home Financials are based on the most recent Mortgage that was taken out on this home.
Original Mortgage
$150,000
Interest Rate
7.15%
Create a Home Valuation Report for This Property
The Home Valuation Report is an in-depth analysis detailing your home's value as well as a comparison with similar homes in the area
Home Values in the Area
Average Home Value in this Area
Purchase History
| Date | Buyer | Sale Price | Title Company |
|---|---|---|---|
| Giordano Paul M | $395,500 | Fidelity National Title Ins |
Source: Public Records
Mortgage History
| Date | Status | Borrower | Loan Amount |
|---|---|---|---|
| Closed | Giordano Paul M | $150,000 |
Source: Public Records
Tax History Compared to Growth
Tax History
| Year | Tax Paid | Tax Assessment Tax Assessment Total Assessment is a certain percentage of the fair market value that is determined by local assessors to be the total taxable value of land and additions on the property. | Land | Improvement |
|---|---|---|---|---|
| 2025 | $10,087 | $47,100 | $18,377 | $28,723 |
| 2024 | $10,087 | $50,220 | $17,421 | $32,799 |
| 2023 | $10,309 | $50,760 | $14,495 | $36,265 |
| 2022 | $10,133 | $54,180 | $16,260 | $37,920 |
| 2021 | $10,127 | $49,560 | $16,260 | $33,300 |
| 2020 | $9,764 | $49,800 | $16,260 | $33,540 |
| 2019 | $9,087 | $49,740 | $16,260 | $33,480 |
| 2018 | $8,325 | $42,300 | $16,260 | $26,040 |
| 2017 | $9,006 | $45,648 | $16,003 | $29,645 |
| 2016 | $8,650 | $44,820 | $16,260 | $28,560 |
| 2015 | $7,897 | $45,288 | $16,153 | $29,135 |
| 2014 | $7,897 | $42,741 | $15,244 | $27,497 |
Source: Public Records
Map
Nearby Homes