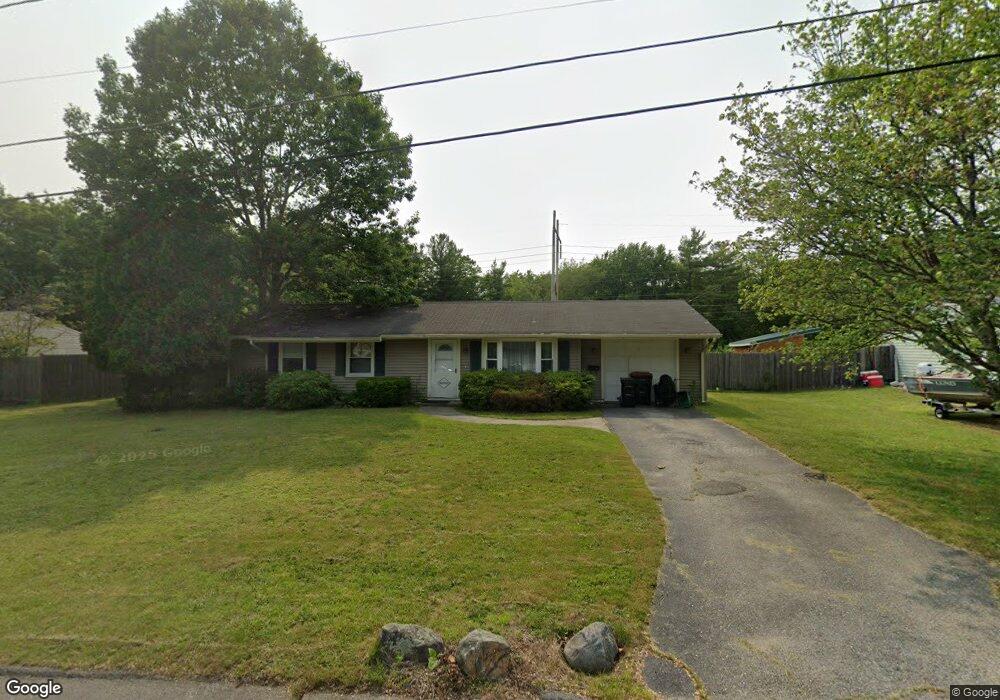
16 Juneau Rd Brockton, MA 02302
Estimated Value: $459,000 - $471,997
3
Beds
1
Bath
1,008
Sq Ft
$462/Sq Ft
Est. Value
About This Home
This home is located at 16 Juneau Rd, Brockton, MA 02302 and is currently estimated at $465,249, approximately $461 per square foot. 16 Juneau Rd is a home located in Plymouth County with nearby schools including Davis K-8 School, John F. Kennedy Elementary School, and South Middle School.
Ownership History
Date
Name
Owned For
Owner Type
Purchase Details
Closed on
Mar 28, 1995
Sold by
Alger Toby and Romero Elizabeth R
Bought by
Martens Patrick M and Martens Liza E
Current Estimated Value
Purchase Details
Closed on
Sep 27, 1994
Sold by
Department Of Housing & Urban Dev
Bought by
Alger Toby and Romero Elizabeth R
Purchase Details
Closed on
May 19, 1993
Sold by
Samuels Craig V and Anchor Mtg Svc Inc
Bought by
Anchor Mtg Svc Inc
Create a Home Valuation Report for This Property
The Home Valuation Report is an in-depth analysis detailing your home's value as well as a comparison with similar homes in the area
Home Values in the Area
Average Home Value in this Area
Purchase History
| Date | Buyer | Sale Price | Title Company |
|---|---|---|---|
| Martens Patrick M | $77,000 | -- | |
| Alger Toby | $45,500 | -- | |
| Anchor Mtg Svc Inc | $59,899 | -- |
Source: Public Records
Mortgage History
| Date | Status | Borrower | Loan Amount |
|---|---|---|---|
| Open | Anchor Mtg Svc Inc | $40,000 | |
| Open | Anchor Mtg Svc Inc | $159,000 |
Source: Public Records
Tax History Compared to Growth
Tax History
| Year | Tax Paid | Tax Assessment Tax Assessment Total Assessment is a certain percentage of the fair market value that is determined by local assessors to be the total taxable value of land and additions on the property. | Land | Improvement |
|---|---|---|---|---|
| 2025 | $4,515 | $372,800 | $167,800 | $205,000 |
| 2024 | $4,415 | $367,300 | $167,800 | $199,500 |
| 2023 | $4,235 | $326,300 | $118,900 | $207,400 |
| 2022 | $4,145 | $296,700 | $108,100 | $188,600 |
| 2021 | $3,960 | $273,100 | $100,400 | $172,700 |
| 2020 | $3,980 | $262,700 | $87,500 | $175,200 |
| 2019 | $3,501 | $225,300 | $84,000 | $141,300 |
| 2018 | $3,451 | $214,900 | $84,000 | $130,900 |
| 2017 | $2,879 | $178,800 | $84,000 | $94,800 |
| 2016 | $3,118 | $179,600 | $80,200 | $99,400 |
| 2015 | $3,018 | $166,300 | $80,200 | $86,100 |
| 2014 | $2,977 | $164,200 | $80,200 | $84,000 |
Source: Public Records
Map
Nearby Homes
- 139 Geralynn Dr
- 578 Plain St
- 51 Darby Rd
- 768 East St
- 122 Sinclair Rd
- 24 Ithica Rd
- 1 Thomas Cir
- 597 East St
- 221 Sinclair Rd
- 229 Sinclair Rd
- 16 Friendship Dr
- 50 Belmont St
- 12 Paulin Ave
- 16 Yuba Cir
- 18 American Ave
- 163 S Leyden St
- 44 Baker St
- 15 Longworth Ave Unit 231
- 34 Carl Ave
- 35 Longworth Ave Unit 17