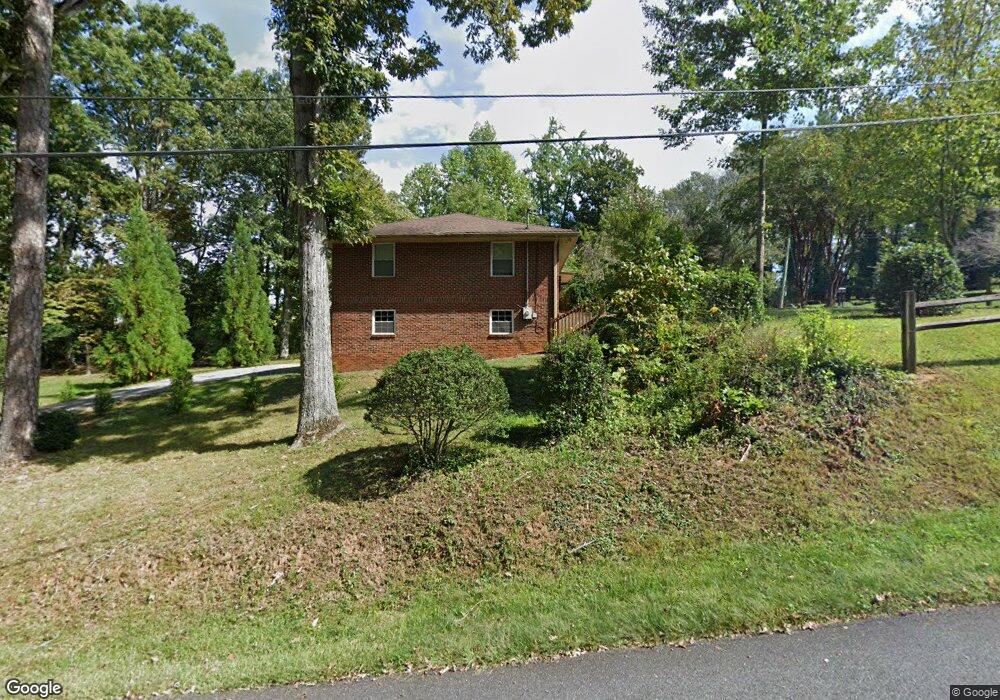
16 Kenimer Dr Dahlonega, GA 30533
Estimated Value: $339,000 - $554,000
--
Bed
1
Bath
2,649
Sq Ft
$151/Sq Ft
Est. Value
About This Home
This home is located at 16 Kenimer Dr, Dahlonega, GA 30533 and is currently estimated at $401,215, approximately $151 per square foot. 16 Kenimer Dr is a home with nearby schools including Clay County Middle School and Lumpkin County High School.
Ownership History
Date
Name
Owned For
Owner Type
Purchase Details
Closed on
Feb 5, 2016
Sold by
Gaddis Clayton Lee
Bought by
Jones Patrick
Current Estimated Value
Home Financials for this Owner
Home Financials are based on the most recent Mortgage that was taken out on this home.
Original Mortgage
$36,700
Outstanding Balance
$29,036
Interest Rate
3.72%
Estimated Equity
$372,179
Purchase Details
Closed on
Aug 31, 2005
Sold by
Bryant Judith A
Bought by
Jones Patrick
Home Financials for this Owner
Home Financials are based on the most recent Mortgage that was taken out on this home.
Original Mortgage
$151,000
Interest Rate
5.77%
Mortgage Type
New Conventional
Purchase Details
Closed on
Oct 1, 2001
Sold by
Bryant Judith A
Bought by
Bryant Judith A
Purchase Details
Closed on
Aug 18, 2000
Sold by
Daigle Mark A
Bought by
Bryant Judith A
Purchase Details
Closed on
Oct 30, 1992
Sold by
Kim T
Bought by
Daigle Mark A
Purchase Details
Closed on
May 1, 1984
Sold by
Betty
Bought by
Graves Dorsey G
Create a Home Valuation Report for This Property
The Home Valuation Report is an in-depth analysis detailing your home's value as well as a comparison with similar homes in the area
Home Values in the Area
Average Home Value in this Area
Purchase History
| Date | Buyer | Sale Price | Title Company |
|---|---|---|---|
| Jones Patrick | -- | -- | |
| Jones Patrick | $151,000 | -- | |
| Bryant Judith A | -- | -- | |
| Bryant Judith A | $135,000 | -- | |
| Daigle Mark A | $66,500 | -- | |
| Graves Dorsey G | -- | -- |
Source: Public Records
Mortgage History
| Date | Status | Borrower | Loan Amount |
|---|---|---|---|
| Open | Jones Patrick | $36,700 | |
| Closed | Jones Patrick | -- | |
| Previous Owner | Jones Patrick | $151,000 |
Source: Public Records
Tax History Compared to Growth
Tax History
| Year | Tax Paid | Tax Assessment Tax Assessment Total Assessment is a certain percentage of the fair market value that is determined by local assessors to be the total taxable value of land and additions on the property. | Land | Improvement |
|---|---|---|---|---|
| 2024 | $2,230 | $79,561 | $15,573 | $63,988 |
| 2023 | $2,191 | $76,009 | $15,573 | $60,436 |
| 2022 | $2,326 | $75,383 | $15,573 | $59,810 |
| 2021 | $2,219 | $69,668 | $15,573 | $54,095 |
| 2020 | $2,279 | $68,909 | $15,573 | $53,336 |
| 2019 | $2,325 | $69,911 | $15,573 | $54,338 |
| 2018 | $2,301 | $64,872 | $15,573 | $49,299 |
| 2017 | $2,069 | $57,542 | $15,573 | $41,969 |
| 2016 | $1,996 | $54,391 | $15,573 | $38,818 |
| 2015 | $1,728 | $54,391 | $15,573 | $38,818 |
| 2014 | $1,728 | $55,097 | $15,573 | $39,524 |
| 2013 | -- | $56,508 | $15,572 | $40,935 |
Source: Public Records
Map
Nearby Homes
- 94 Mountain View Dr
- 490 N Hall Rd
- 399 N Chestatee St
- 95 Jones St
- 22 Honeysuckle Ln
- 97 Beaumont Dr
- 315 Church St
- 502 Wimpy Mill Rd
- 0 Highway 19 N Unit 10594984
- 168 W Main St
- 0 S Chestatee St Unit 10619536
- 253 Blair Ridge Rd
- 1392 S Chestatee St
- 159 Misty Way
- LOT 6 Sky Country Rd
- 120 Blair Ridge Rd
- 121 Blair Ridge Rd
- 0 Dawsonville Hwy Unit 10631159
- 00 Dawsonville Hwy
- 329 Morrison Moore Pkwy E
- 24 N Hall Rd
- 146 Skyline Dr
- 121 Skyline Dr
- 52 Kenimer Cir
- 50 N Hall Rd
- 47 Kenimer Cir
- 795 Grove St N
- 141 Skyline Dr
- 8 Laurel Heights Dr
- 60 Skyline Dr
- 112 N Hall Rd
- 66 N Hall Rd
- 164 Skyline Dr
- 35 Laurel Heights Dr
- 71 Kenimer Cir
- 39 Skyline Dr
- 151 Skyline Dr
- 104 Kenimer Cir
- 84 N Hall Rd
- 36 Laurel Heights Dr