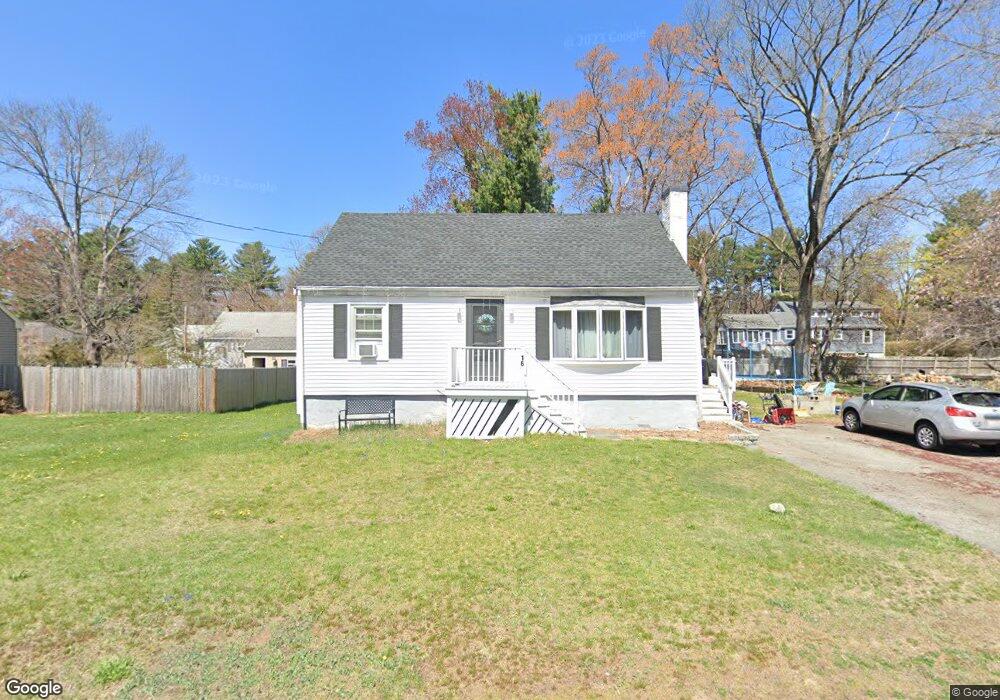
16 Keyes Rd Billerica, MA 01821
Estimated Value: $563,000 - $678,000
4
Beds
1
Bath
1,224
Sq Ft
$494/Sq Ft
Est. Value
About This Home
This home is located at 16 Keyes Rd, Billerica, MA 01821 and is currently estimated at $604,701, approximately $494 per square foot. 16 Keyes Rd is a home located in Middlesex County with nearby schools including Billerica Memorial High School.
Ownership History
Date
Name
Owned For
Owner Type
Purchase Details
Closed on
Mar 5, 2009
Sold by
Bank Of New York
Bought by
Porter Eric W and Porter Erica A
Current Estimated Value
Purchase Details
Closed on
Sep 19, 2008
Sold by
Smathers Daniel E and Smathers Carolann
Bought by
Bank Of New York
Purchase Details
Closed on
Apr 13, 2004
Sold by
Smathers Carolann and Smathers Daniel E
Bought by
Smathers Carolann and Smathers Daniel E
Purchase Details
Closed on
Jun 25, 1999
Sold by
Mclaughlin Shaun and Nicewicz Tammy
Bought by
Smathers Daniel and Smathers Carolann
Purchase Details
Closed on
Apr 23, 1991
Sold by
Mcisaac Lawrence L and Mcisaac Deborah E
Bought by
Mclaughlin Shaun and Nicewicz Tammy
Purchase Details
Closed on
Nov 20, 1987
Sold by
Ramsdell Robt E
Bought by
Mcisaac Lawrence
Create a Home Valuation Report for This Property
The Home Valuation Report is an in-depth analysis detailing your home's value as well as a comparison with similar homes in the area
Home Values in the Area
Average Home Value in this Area
Purchase History
| Date | Buyer | Sale Price | Title Company |
|---|---|---|---|
| Porter Eric W | $230,000 | -- | |
| Bank Of New York | $270,647 | -- | |
| Bank Of New York | $270,647 | -- | |
| Smathers Carolann | -- | -- | |
| Smathers Daniel | $168,000 | -- | |
| Mclaughlin Shaun | $144,000 | -- | |
| Mcisaac Lawrence | $148,000 | -- |
Source: Public Records
Mortgage History
| Date | Status | Borrower | Loan Amount |
|---|---|---|---|
| Open | Mcisaac Lawrence | $233,933 | |
| Closed | Mcisaac Lawrence | $232,190 |
Source: Public Records
Tax History Compared to Growth
Tax History
| Year | Tax Paid | Tax Assessment Tax Assessment Total Assessment is a certain percentage of the fair market value that is determined by local assessors to be the total taxable value of land and additions on the property. | Land | Improvement |
|---|---|---|---|---|
| 2025 | $5,685 | $500,000 | $270,400 | $229,600 |
| 2024 | $5,420 | $480,100 | $261,800 | $218,300 |
| 2023 | $5,403 | $455,200 | $238,300 | $216,900 |
| 2022 | $4,791 | $379,000 | $203,600 | $175,400 |
| 2021 | $9,188 | $346,100 | $178,800 | $167,300 |
| 2020 | $4,405 | $339,100 | $171,800 | $167,300 |
| 2019 | $4,275 | $317,100 | $171,800 | $145,300 |
| 2018 | $4,082 | $287,700 | $152,700 | $135,000 |
| 2017 | $3,933 | $279,100 | $151,100 | $128,000 |
| 2016 | $3,897 | $275,600 | $147,600 | $128,000 |
| 2015 | $3,808 | $271,200 | $143,200 | $128,000 |
| 2014 | $3,793 | $265,400 | $138,700 | $126,700 |
Source: Public Records
Map
Nearby Homes