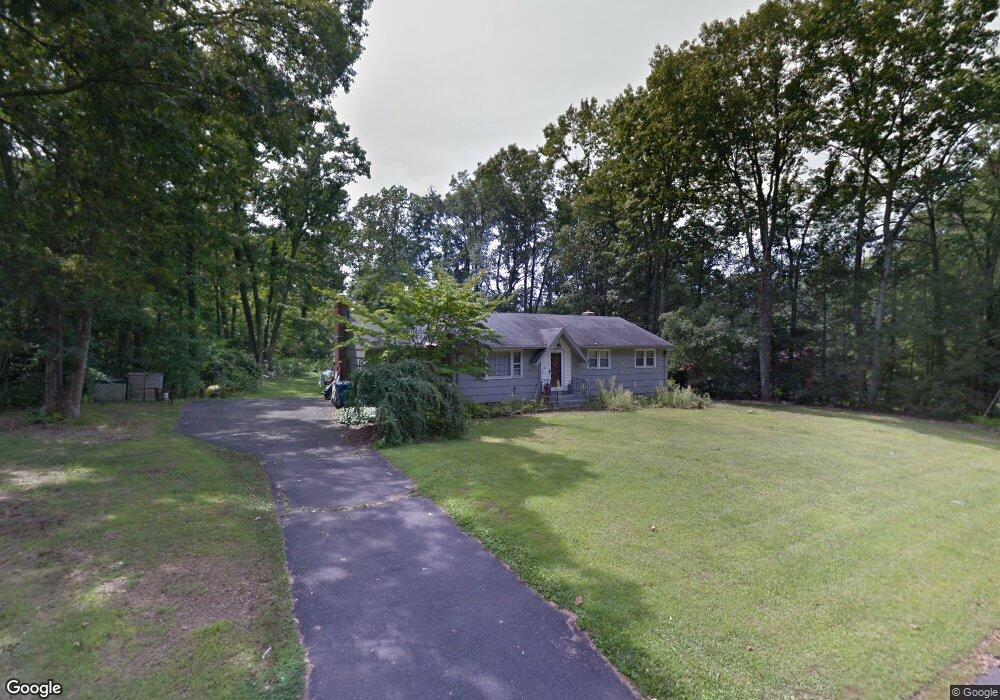
16 Lanz Ln Ellington, CT 06029
Estimated Value: $364,030 - $406,000
3
Beds
2
Baths
1,408
Sq Ft
$269/Sq Ft
Est. Value
About This Home
This home is located at 16 Lanz Ln, Ellington, CT 06029 and is currently estimated at $378,258, approximately $268 per square foot. 16 Lanz Ln is a home located in Tolland County with nearby schools including Ellington High School.
Ownership History
Date
Name
Owned For
Owner Type
Purchase Details
Closed on
Jul 1, 2002
Sold by
Mcdonald Kevin
Bought by
Conde Jennifer and Conde Jesus
Current Estimated Value
Home Financials for this Owner
Home Financials are based on the most recent Mortgage that was taken out on this home.
Original Mortgage
$142,400
Interest Rate
6.92%
Purchase Details
Closed on
Apr 1, 1998
Sold by
Allanach Thomas
Bought by
Mcdonald Kevin
Home Financials for this Owner
Home Financials are based on the most recent Mortgage that was taken out on this home.
Original Mortgage
$101,500
Interest Rate
6.89%
Mortgage Type
Unknown
Purchase Details
Closed on
Apr 14, 1993
Sold by
Gorman James F and Lotreck Kevin
Bought by
Allanack Thomas
Home Financials for this Owner
Home Financials are based on the most recent Mortgage that was taken out on this home.
Original Mortgage
$113,400
Interest Rate
7%
Mortgage Type
Unknown
Purchase Details
Closed on
Sep 2, 1987
Sold by
Hyland Emma
Bought by
Gorman James F
Create a Home Valuation Report for This Property
The Home Valuation Report is an in-depth analysis detailing your home's value as well as a comparison with similar homes in the area
Home Values in the Area
Average Home Value in this Area
Purchase History
| Date | Buyer | Sale Price | Title Company |
|---|---|---|---|
| Conde Jennifer | $178,000 | -- | |
| Mcdonald Kevin | $126,900 | -- | |
| Allanack Thomas | $114,500 | -- | |
| Gorman James F | $148,900 | -- |
Source: Public Records
Mortgage History
| Date | Status | Borrower | Loan Amount |
|---|---|---|---|
| Open | Gorman James F | $113,904 | |
| Closed | Gorman James F | $142,400 | |
| Previous Owner | Gorman James F | $101,500 | |
| Previous Owner | Gorman James F | $113,400 |
Source: Public Records
Tax History
| Year | Tax Paid | Tax Assessment Tax Assessment Total Assessment is a certain percentage of the fair market value that is determined by local assessors to be the total taxable value of land and additions on the property. | Land | Improvement |
|---|---|---|---|---|
| 2025 | $5,434 | $146,480 | $59,130 | $87,350 |
| 2024 | $5,273 | $146,480 | $59,130 | $87,350 |
| 2023 | $5,024 | $146,480 | $59,130 | $87,350 |
| 2022 | $4,761 | $146,480 | $59,130 | $87,350 |
| 2021 | $4,629 | $146,480 | $59,130 | $87,350 |
| 2020 | $4,682 | $143,620 | $59,160 | $84,460 |
| 2019 | $4,682 | $143,620 | $59,160 | $84,460 |
| 2016 | $4,380 | $143,620 | $59,160 | $84,460 |
| 2015 | $4,197 | $153,840 | $59,160 | $94,680 |
| 2014 | $4,415 | $153,840 | $59,160 | $94,680 |
Source: Public Records
Map
Nearby Homes
- 33 Lanz Ln
- 0 Porter Rd
- 96 Muddy Brook Rd
- 43 Jamestown Rd
- 58 Maple St
- 41 Cider Mill Rd
- 0000 Webster Rd
- 969 Main St
- 138 Main St
- 45 Sokol Rd
- 20 Shaker Rd
- 283 Mountain View Rd
- 10 Bailey Rd
- 89 Crystal Lake Rd Unit T7
- 3 Meagan Cir
- 6 Setting Sun Trail
- 222 Mountain Rd
- 2 Setting Sun Trail
- 9 Wheelock Rd
- 160 East Rd
Your Personal Tour Guide
Ask me questions while you tour the home.