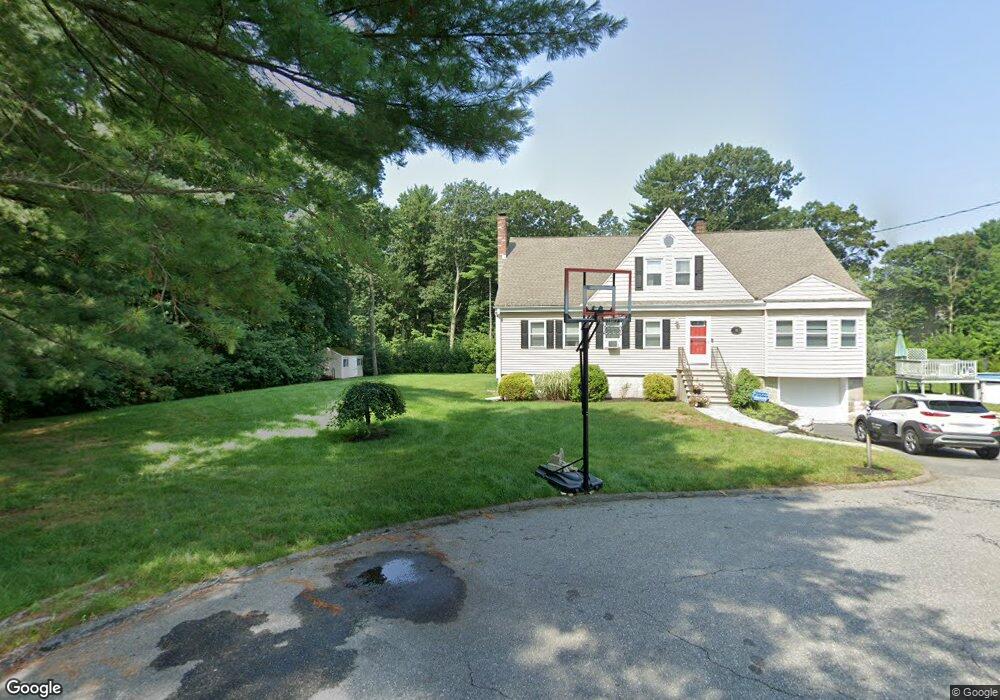
16 Lawrence Ct Wilmington, MA 01887
North Wilmington NeighborhoodEstimated Value: $844,931 - $879,000
6
Beds
2
Baths
2,009
Sq Ft
$432/Sq Ft
Est. Value
About This Home
This home is located at 16 Lawrence Ct, Wilmington, MA 01887 and is currently estimated at $868,483, approximately $432 per square foot. 16 Lawrence Ct is a home located in Middlesex County with nearby schools including Wilmington Middle School, Wilmington High School, and Abundant Life Christian School and Childcare.
Ownership History
Date
Name
Owned For
Owner Type
Purchase Details
Closed on
Mar 18, 2021
Sold by
Levesque Wayne and Levesque Julie
Bought by
Levesque Julie
Current Estimated Value
Home Financials for this Owner
Home Financials are based on the most recent Mortgage that was taken out on this home.
Original Mortgage
$500,000
Outstanding Balance
$443,913
Interest Rate
2.8%
Mortgage Type
New Conventional
Estimated Equity
$424,570
Purchase Details
Closed on
Sep 17, 2007
Sold by
Levesque Julie and Solari Norrine
Bought by
Levesque Julie and Levesque Wayne
Purchase Details
Closed on
Aug 30, 2005
Sold by
Mcvicker Joan T Est and Foster
Bought by
Levesque Julie and Solari Norrine
Home Financials for this Owner
Home Financials are based on the most recent Mortgage that was taken out on this home.
Original Mortgage
$348,000
Interest Rate
5.68%
Mortgage Type
Purchase Money Mortgage
Create a Home Valuation Report for This Property
The Home Valuation Report is an in-depth analysis detailing your home's value as well as a comparison with similar homes in the area
Home Values in the Area
Average Home Value in this Area
Purchase History
| Date | Buyer | Sale Price | Title Company |
|---|---|---|---|
| Levesque Julie | -- | None Available | |
| Levesque Julie | -- | -- | |
| Levesque Julie | -- | -- | |
| Levesque Julie | $435,000 | -- | |
| Levesque Julie | $435,000 | -- |
Source: Public Records
Mortgage History
| Date | Status | Borrower | Loan Amount |
|---|---|---|---|
| Open | Levesque Julie | $500,000 | |
| Previous Owner | Levesque Julie | $335,000 | |
| Previous Owner | Levesque Julie | $348,000 |
Source: Public Records
Tax History
| Year | Tax Paid | Tax Assessment Tax Assessment Total Assessment is a certain percentage of the fair market value that is determined by local assessors to be the total taxable value of land and additions on the property. | Land | Improvement |
|---|---|---|---|---|
| 2025 | $8,892 | $776,600 | $310,100 | $466,500 |
| 2024 | $8,464 | $740,500 | $310,100 | $430,400 |
| 2023 | $8,428 | $705,900 | $281,800 | $424,100 |
| 2022 | $8,230 | $631,600 | $234,800 | $396,800 |
| 2021 | $8,128 | $587,300 | $213,400 | $373,900 |
| 2020 | $8,110 | $597,200 | $213,400 | $383,800 |
| 2019 | $8,166 | $593,900 | $203,400 | $390,500 |
| 2018 | $7,732 | $536,600 | $193,600 | $343,000 |
| 2017 | $7,377 | $510,500 | $193,600 | $316,900 |
| 2016 | $6,883 | $470,500 | $184,500 | $286,000 |
| 2015 | $6,523 | $453,900 | $184,500 | $269,400 |
| 2014 | $6,375 | $447,700 | $175,700 | $272,000 |
Source: Public Records
Map
Nearby Homes
- 12 Hamlin Ln
- 15 Mystic Ave
- 3 Clark Terrace
- 46 Cottage St
- 48 Brand Ave
- 56 Grove Ave
- 8 McDonald Rd
- 21 Marcia Rd
- 300 Woburn St
- 51 Valley Rd
- 35 Oak St
- 79 Valley Rd
- 197 Wildwood St
- 4 Lockwood Rd
- 14 Manning St
- 7 Cross St Unit 301
- 7 Cross St Unit 303
- 7 Cross St Unit 205
- 7 Cross St Unit 306
- 7 Cross St Unit 102
Your Personal Tour Guide
Ask me questions while you tour the home.