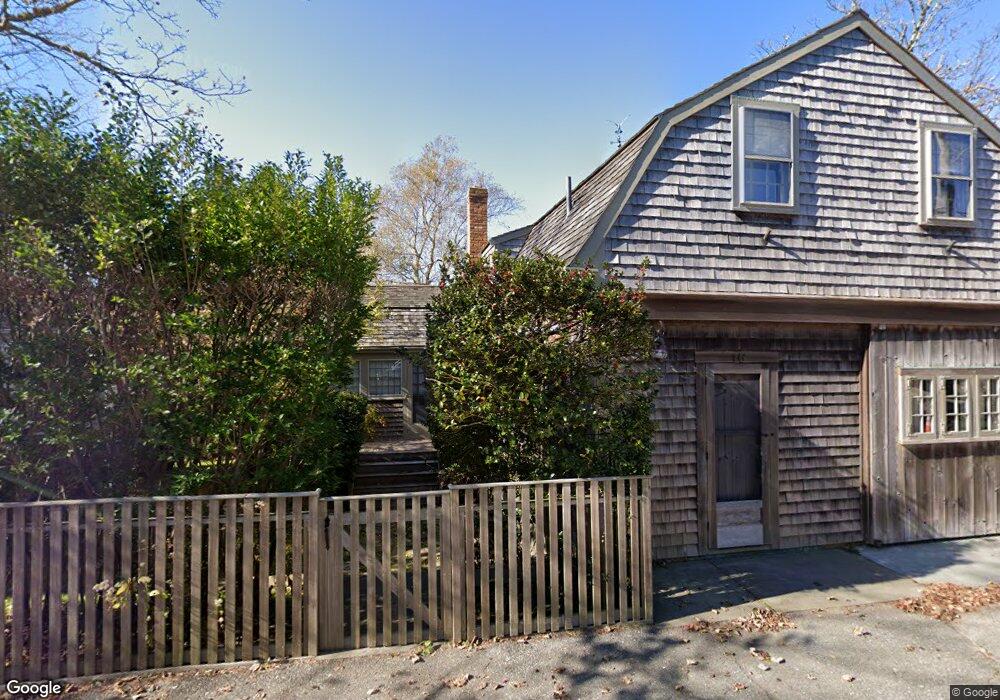
16 Lily St Nantucket, MA 02554
Estimated Value: $4,068,000 - $5,055,000
3
Beds
2
Baths
2,622
Sq Ft
$1,697/Sq Ft
Est. Value
About This Home
This home is located at 16 Lily St, Nantucket, MA 02554 and is currently estimated at $4,449,611, approximately $1,697 per square foot. 16 Lily St is a home located in Nantucket County with nearby schools including Nantucket Elementary School, Cyrus Peirce Middle School, and Nantucket High School.
Ownership History
Date
Name
Owned For
Owner Type
Purchase Details
Closed on
Sep 18, 2012
Sold by
Conover Catherine M
Bought by
16 Lily Street Llc
Current Estimated Value
Purchase Details
Closed on
Aug 17, 2007
Sold by
Loeb Nt and Demakis
Bought by
Hutchinson Eben and Hutchinson Lois M
Purchase Details
Closed on
Sep 9, 1998
Sold by
Jaffe Stanley R and Jaffe Melinda J
Bought by
Conover Catherine M
Purchase Details
Closed on
Mar 27, 1995
Sold by
Mcclure James
Bought by
Jaffe Stanley R and Jaffe Melinda J
Home Financials for this Owner
Home Financials are based on the most recent Mortgage that was taken out on this home.
Original Mortgage
$400,000
Interest Rate
8.34%
Purchase Details
Closed on
Nov 23, 1987
Sold by
Citytrust
Bought by
Mcclure James
Create a Home Valuation Report for This Property
The Home Valuation Report is an in-depth analysis detailing your home's value as well as a comparison with similar homes in the area
Home Values in the Area
Average Home Value in this Area
Purchase History
| Date | Buyer | Sale Price | Title Company |
|---|---|---|---|
| 16 Lily Street Llc | -- | -- | |
| 16 Lily Street Llc | -- | -- | |
| Hutchinson Eben | -- | -- | |
| Hutchinson Eben | -- | -- | |
| Hutchinson Eben | -- | -- | |
| Conover Catherine M | $1,395,000 | -- | |
| Conover Catherine M | $1,395,000 | -- | |
| Jaffe Stanley R | $549,000 | -- | |
| Jaffe Stanley R | $549,000 | -- | |
| Mcclure James | $338,800 | -- |
Source: Public Records
Mortgage History
| Date | Status | Borrower | Loan Amount |
|---|---|---|---|
| Previous Owner | Mcclure James | $400,000 | |
| Previous Owner | Mcclure James | $130,000 |
Source: Public Records
Tax History Compared to Growth
Tax History
| Year | Tax Paid | Tax Assessment Tax Assessment Total Assessment is a certain percentage of the fair market value that is determined by local assessors to be the total taxable value of land and additions on the property. | Land | Improvement |
|---|---|---|---|---|
| 2025 | $11,929 | $3,636,800 | $2,317,500 | $1,319,300 |
| 2024 | $11,275 | $3,602,200 | $2,317,500 | $1,284,700 |
| 2023 | $10,178 | $3,170,600 | $2,207,800 | $962,800 |
| 2022 | $9,911 | $2,650,000 | $1,843,000 | $807,000 |
| 2021 | $9,406 | $2,591,100 | $1,697,500 | $893,600 |
| 2020 | $9,417 | $2,729,500 | $1,697,500 | $1,032,000 |
| 2019 | $9,142 | $2,720,800 | $1,688,800 | $1,032,000 |
| 2018 | $8,276 | $2,399,000 | $1,688,800 | $710,200 |
| 2017 | $8,067 | $2,379,600 | $1,688,800 | $690,800 |
| 2016 | $7,220 | $2,148,700 | $1,477,300 | $671,400 |
| 2015 | $7,613 | $2,108,900 | $1,500,400 | $608,500 |
| 2014 | $7,253 | $1,928,900 | $1,320,400 | $608,500 |
Source: Public Records
Map
Nearby Homes