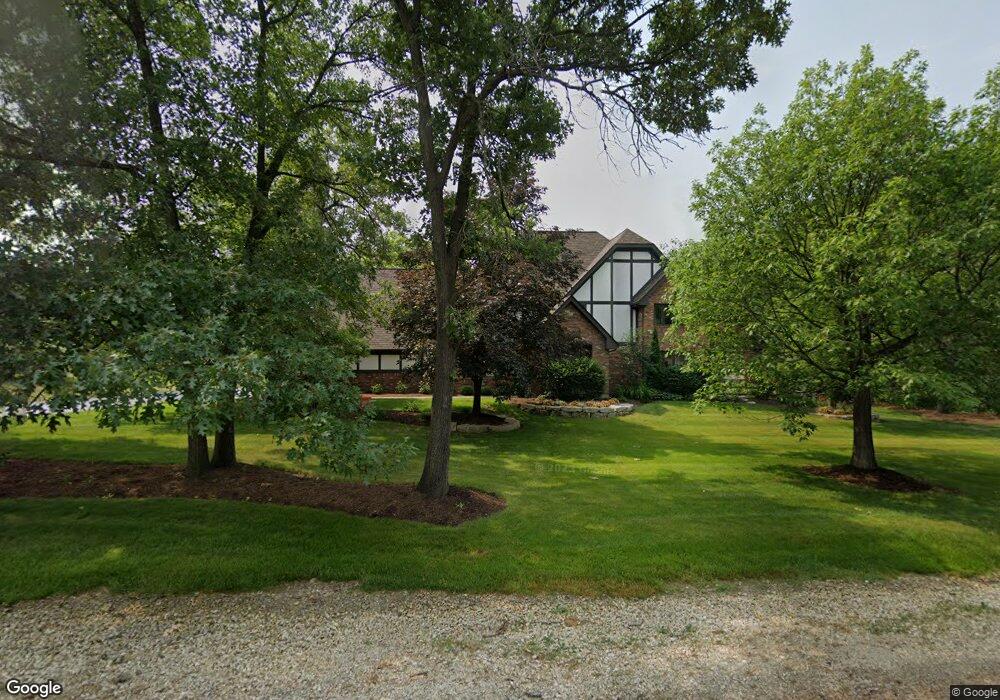
16 Longwood Way Unit 2 Lemont, IL 60439
West Lemont NeighborhoodEstimated Value: $525,000 - $827,000
3
Beds
3
Baths
3,112
Sq Ft
$228/Sq Ft
Est. Value
About This Home
This home is located at 16 Longwood Way Unit 2, Lemont, IL 60439 and is currently estimated at $710,280, approximately $228 per square foot. 16 Longwood Way Unit 2 is a home located in Cook County with nearby schools including Oakwood School, River Valley School, and Old Quarry Middle School.
Ownership History
Date
Name
Owned For
Owner Type
Purchase Details
Closed on
Aug 26, 2011
Sold by
Us Bank National Association
Bought by
Bergeson Garrett and Bergeson Jamie
Current Estimated Value
Home Financials for this Owner
Home Financials are based on the most recent Mortgage that was taken out on this home.
Original Mortgage
$302,116
Outstanding Balance
$206,788
Interest Rate
4.25%
Mortgage Type
FHA
Estimated Equity
$503,492
Purchase Details
Closed on
Dec 21, 2010
Sold by
Gradows Daniel S
Bought by
U S Bank National Association
Purchase Details
Closed on
Dec 30, 2005
Sold by
Des Lauriers Thomas J
Bought by
Gradows Daniel S
Home Financials for this Owner
Home Financials are based on the most recent Mortgage that was taken out on this home.
Original Mortgage
$380,000
Interest Rate
9.69%
Mortgage Type
Fannie Mae Freddie Mac
Create a Home Valuation Report for This Property
The Home Valuation Report is an in-depth analysis detailing your home's value as well as a comparison with similar homes in the area
Home Values in the Area
Average Home Value in this Area
Purchase History
| Date | Buyer | Sale Price | Title Company |
|---|---|---|---|
| Bergeson Garrett | $275,000 | None Available | |
| U S Bank National Association | -- | None Available | |
| Gradows Daniel S | $475,000 | First American Title Ins Co |
Source: Public Records
Mortgage History
| Date | Status | Borrower | Loan Amount |
|---|---|---|---|
| Open | Bergeson Garrett | $302,116 | |
| Previous Owner | Gradows Daniel S | $380,000 |
Source: Public Records
Tax History Compared to Growth
Tax History
| Year | Tax Paid | Tax Assessment Tax Assessment Total Assessment is a certain percentage of the fair market value that is determined by local assessors to be the total taxable value of land and additions on the property. | Land | Improvement |
|---|---|---|---|---|
| 2024 | $9,933 | $54,553 | $26,700 | $27,853 |
| 2023 | $9,013 | $54,762 | $26,700 | $28,062 |
| 2022 | $9,013 | $43,430 | $10,269 | $33,161 |
| 2021 | $8,775 | $43,430 | $10,269 | $33,161 |
| 2020 | $8,951 | $43,430 | $10,269 | $33,161 |
| 2019 | $8,090 | $40,944 | $10,269 | $30,675 |
| 2018 | $8,420 | $43,099 | $10,269 | $32,830 |
| 2017 | $9,199 | $47,292 | $10,269 | $37,023 |
| 2016 | $8,507 | $41,183 | $8,215 | $32,968 |
| 2015 | $8,629 | $41,183 | $8,215 | $32,968 |
| 2014 | $8,742 | $41,183 | $8,215 | $32,968 |
| 2013 | $8,898 | $44,448 | $8,215 | $36,233 |
Source: Public Records
Map
Nearby Homes
- 13027 Blue Grass Dr
- 16701 135th St
- 12891 Mayfair Dr
- 16540 Kayla Dr
- 16560 Kayla Dr
- 16550 Kayla Dr
- Ravello Plan at Villas at Rolling Meadows
- Verona Plan at Villas at Rolling Meadows
- Capri Plan at Villas at Rolling Meadows
- Sorrento Plan at Villas at Rolling Meadows
- 16520 Kayla Dr
- 16530 Kayla Dr
- 16451 Kayla Dr
- 16541 Kayla Dr
- 1365 Gordon Ln
- 1383 Gordon Ln
- 16705 W 138th St
- 15822 132nd St
- 1201 Leinster Dr
- 17365 W 135th St
- 18 Longwood Way
- 14 Longwood Way
- 17 Valley View Dr
- 19 Valley View Dr
- 15 Valley View Dr
- 1280 Fairway Dr
- 15 Longwood Way
- 20 Longwood Way
- 12 Longwood Way
- 21 Valley View Dr
- 1 Oakmont Ct
- 3 Oakmont Ct
- 1303 Oakmont Dr Unit 1
- 31 Valley View Dr
- 1279 Fairway Dr
- 1276 Fairway Dr
- 22 Longwood Way
- 27 Valley View Dr
- 18 Valley View Dr
- 20 Valley View Dr