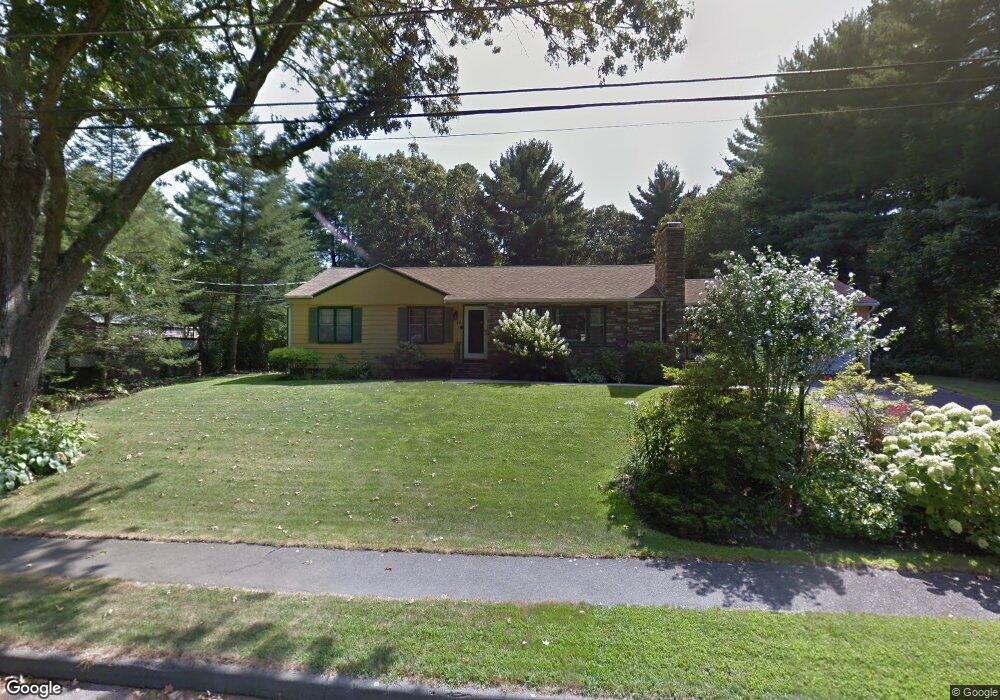
16 Lovell Rd Lynnfield, MA 01940
Estimated Value: $974,034 - $1,199,000
3
Beds
2
Baths
2,310
Sq Ft
$466/Sq Ft
Est. Value
About This Home
This home is located at 16 Lovell Rd, Lynnfield, MA 01940 and is currently estimated at $1,077,259, approximately $466 per square foot. 16 Lovell Rd is a home located in Essex County with nearby schools including Lynnfield Middle School, Pickering Middle School, and Lynnfield High School.
Ownership History
Date
Name
Owned For
Owner Type
Purchase Details
Closed on
Apr 28, 2017
Sold by
Brezzani Alexander
Bought by
16 Lovell Road Nt
Current Estimated Value
Purchase Details
Closed on
Aug 26, 1996
Sold by
Fucarile Thomas M
Bought by
Baker Burton
Home Financials for this Owner
Home Financials are based on the most recent Mortgage that was taken out on this home.
Original Mortgage
$150,000
Interest Rate
8.4%
Mortgage Type
Purchase Money Mortgage
Create a Home Valuation Report for This Property
The Home Valuation Report is an in-depth analysis detailing your home's value as well as a comparison with similar homes in the area
Home Values in the Area
Average Home Value in this Area
Purchase History
| Date | Buyer | Sale Price | Title Company |
|---|---|---|---|
| 16 Lovell Road Nt | -- | -- | |
| Baker Burton | $295,000 | -- |
Source: Public Records
Mortgage History
| Date | Status | Borrower | Loan Amount |
|---|---|---|---|
| Previous Owner | Baker Burton | $150,000 | |
| Closed | Baker Burton | $50,000 |
Source: Public Records
Tax History Compared to Growth
Tax History
| Year | Tax Paid | Tax Assessment Tax Assessment Total Assessment is a certain percentage of the fair market value that is determined by local assessors to be the total taxable value of land and additions on the property. | Land | Improvement |
|---|---|---|---|---|
| 2025 | $9,322 | $882,800 | $612,400 | $270,400 |
| 2024 | $8,925 | $849,200 | $588,900 | $260,300 |
| 2023 | $9,034 | $799,500 | $558,500 | $241,000 |
| 2022 | $8,681 | $724,000 | $512,900 | $211,100 |
| 2021 | $7,865 | $592,700 | $391,300 | $201,400 |
| 2020 | $7,511 | $539,600 | $338,100 | $201,500 |
| 2019 | $7,294 | $524,400 | $322,900 | $201,500 |
| 2018 | $7,075 | $514,200 | $322,900 | $191,300 |
| 2017 | $7,086 | $514,200 | $322,900 | $191,300 |
| 2016 | $6,786 | $468,000 | $288,700 | $179,300 |
| 2015 | $6,664 | $459,900 | $288,700 | $171,200 |
Source: Public Records
Map
Nearby Homes