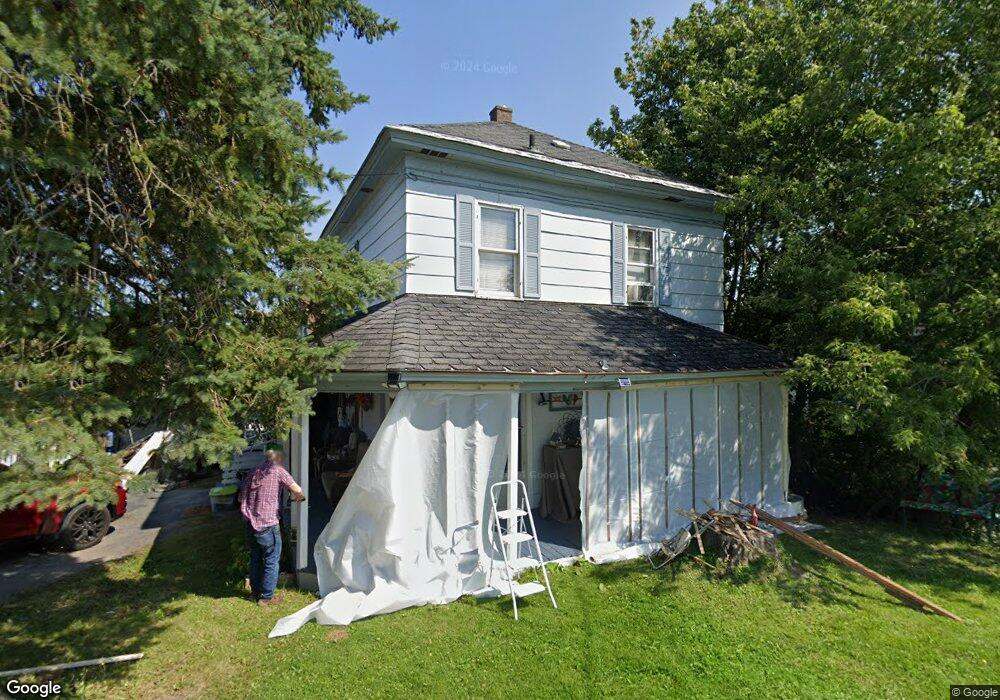
16 Lower Lyndon St Caribou, ME 04736
Estimated Value: $105,000 - $155,000
3
Beds
2
Baths
1,134
Sq Ft
$109/Sq Ft
Est. Value
About This Home
This home is located at 16 Lower Lyndon St, Caribou, ME 04736 and is currently estimated at $123,344, approximately $108 per square foot. 16 Lower Lyndon St is a home located in Aroostook County.
Ownership History
Date
Name
Owned For
Owner Type
Purchase Details
Closed on
Apr 13, 2021
Sold by
County Fcu
Bought by
Boxwell Ervin A and Boxwell Sandra J
Current Estimated Value
Home Financials for this Owner
Home Financials are based on the most recent Mortgage that was taken out on this home.
Original Mortgage
$23,000
Outstanding Balance
$20,733
Interest Rate
2.9%
Mortgage Type
Purchase Money Mortgage
Estimated Equity
$102,611
Purchase Details
Closed on
Jan 5, 2007
Sold by
Mcbreairty Kelly E
Bought by
Griffin Sherry L
Home Financials for this Owner
Home Financials are based on the most recent Mortgage that was taken out on this home.
Original Mortgage
$49,976
Interest Rate
6.24%
Mortgage Type
FHA
Create a Home Valuation Report for This Property
The Home Valuation Report is an in-depth analysis detailing your home's value as well as a comparison with similar homes in the area
Home Values in the Area
Average Home Value in this Area
Purchase History
| Date | Buyer | Sale Price | Title Company |
|---|---|---|---|
| Boxwell Ervin A | -- | None Available | |
| Griffin Sherry L | -- | -- |
Source: Public Records
Mortgage History
| Date | Status | Borrower | Loan Amount |
|---|---|---|---|
| Open | Boxwell Ervin A | $23,000 | |
| Previous Owner | Griffin Sherry L | $49,976 |
Source: Public Records
Tax History Compared to Growth
Tax History
| Year | Tax Paid | Tax Assessment Tax Assessment Total Assessment is a certain percentage of the fair market value that is determined by local assessors to be the total taxable value of land and additions on the property. | Land | Improvement |
|---|---|---|---|---|
| 2024 | $1,723 | $80,500 | $9,500 | $71,000 |
| 2023 | $1,570 | $80,500 | $9,500 | $71,000 |
| 2022 | $1,208 | $51,300 | $8,200 | $43,100 |
| 2021 | $1,208 | $51,300 | $8,200 | $43,100 |
| 2020 | $1,208 | $51,300 | $8,200 | $43,100 |
| 2019 | $1,259 | $51,300 | $8,200 | $43,100 |
| 2018 | $1,216 | $51,300 | $8,200 | $43,100 |
| 2017 | $1,226 | $51,300 | $8,200 | $43,100 |
| 2016 | $1,175 | $51,300 | $8,200 | $43,100 |
| 2015 | $1,152 | $51,300 | $8,200 | $43,100 |
| 2014 | $1,144 | $51,300 | $8,200 | $43,100 |
Source: Public Records
Map
Nearby Homes