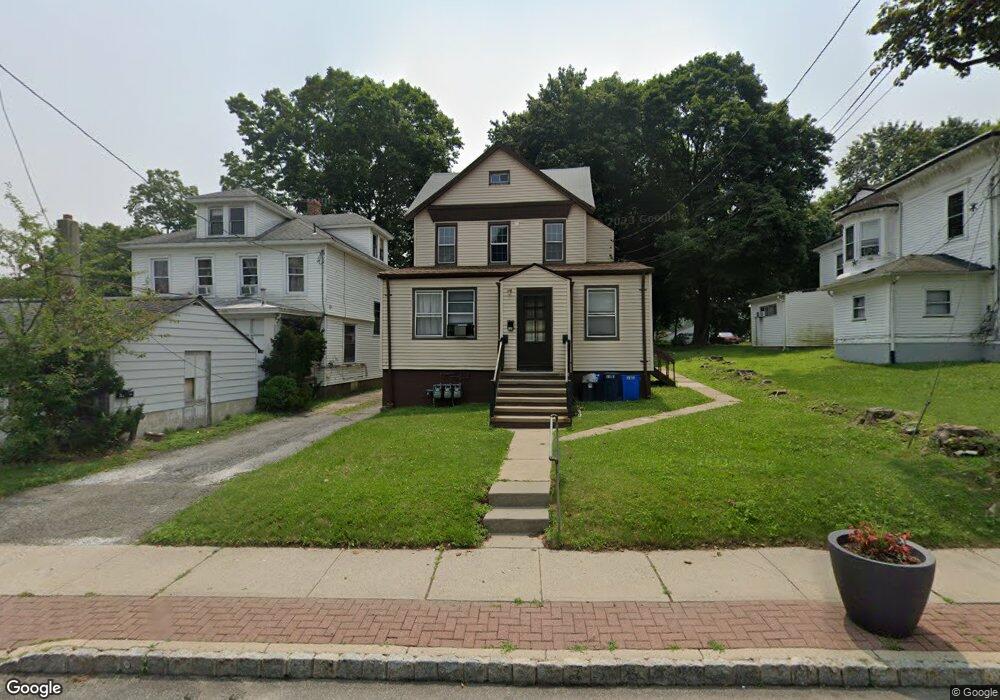
16 Main St Netcong, NJ 07857
Estimated Value: $405,473 - $486,000
Studio
--
Bath
1,525
Sq Ft
$288/Sq Ft
Est. Value
About This Home
This home is located at 16 Main St, Netcong, NJ 07857 and is currently estimated at $439,618, approximately $288 per square foot. 16 Main St is a home located in Morris County with nearby schools including Netcong Elementary School and Lenape Val Regional High School.
Ownership History
Date
Name
Owned For
Owner Type
Purchase Details
Closed on
Jun 10, 2021
Sold by
Best James A
Bought by
48 Algonquin Llc
Current Estimated Value
Home Financials for this Owner
Home Financials are based on the most recent Mortgage that was taken out on this home.
Original Mortgage
$275,650
Interest Rate
2.9%
Mortgage Type
Commercial
Purchase Details
Closed on
May 27, 2010
Sold by
Best Claire M
Bought by
Best James A
Home Financials for this Owner
Home Financials are based on the most recent Mortgage that was taken out on this home.
Original Mortgage
$150,000
Interest Rate
5.12%
Mortgage Type
New Conventional
Create a Home Valuation Report for This Property
The Home Valuation Report is an in-depth analysis detailing your home's value as well as a comparison with similar homes in the area
Home Values in the Area
Average Home Value in this Area
Purchase History
| Date | Buyer | Sale Price | Title Company |
|---|---|---|---|
| 48 Algonquin Llc | $278,000 | Max Title Agency Llc | |
| Best James A | $217,500 | None Available |
Source: Public Records
Mortgage History
| Date | Status | Borrower | Loan Amount |
|---|---|---|---|
| Closed | 48 Algonquin Llc | $275,650 | |
| Previous Owner | Best James A | $150,000 |
Source: Public Records
Tax History
| Year | Tax Paid | Tax Assessment Tax Assessment Total Assessment is a certain percentage of the fair market value that is determined by local assessors to be the total taxable value of land and additions on the property. | Land | Improvement |
|---|---|---|---|---|
| 2025 | $8,495 | $248,600 | $97,400 | $151,200 |
| 2024 | $8,569 | $248,600 | $97,400 | $151,200 |
Source: Public Records
Map
Nearby Homes
- 22 Kelly Place
- 79 Main St
- 74 Main St
- 16-18 King St
- 35 Hillside Ave
- 20 Barone St
- 49 Brooklyn Rd
- 4 Elizabeth Ave
- 58 Silas Rd Unit G
- 58 Brooklyn Rd
- 50 Silas Rd
- Lehigh Plan at Mount Olive Grove - Singles
- Columbia Plan at Mount Olive Grove - Singles
- Hudson Plan at Mount Olive Grove - Singles
- Sonata Plan at Mount Olive Grove - Towns
- Griffin Hall Plan at Mount Olive Grove - Carriage Homes
- Rosecliff Plan at Mount Olive Grove - Carriage Homes
- 7 Walton Place
- 2 Roberts Place
- 8 Hillside Ave
- 16 Main St Unit A
- 16 Main St Unit C
- 16 Main St Unit A-C
- 18 Main St
- 10 Main St
- 24 Main St
- 8 Main St
- 28 Main St Unit 30
- 17 Main St
- 10 Ledgewood Ave
- 21 Main St Unit 1
- 21 Main St
- 4-8 Ledgewood Ave
- 4 Ledgewood Ave Unit 9999
- 36 Main St
- 2 Main St
- 12 Ledgewood Ave
- 23 Main St
- 25 Main St
- 1 Jenny Lind Street 16 Unit 16
Your Personal Tour Guide
Ask me questions while you tour the home.