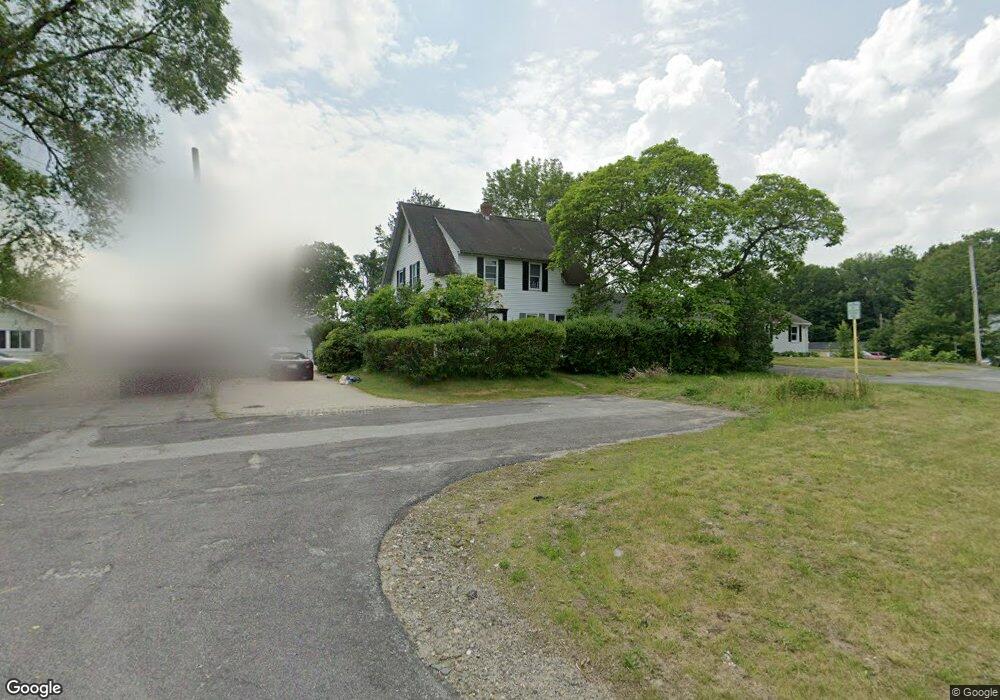
16 Main St Unit 1 Shrewsbury, MA 01545
Estimated Value: $408,000 - $558,000
3
Beds
2
Baths
1,553
Sq Ft
$297/Sq Ft
Est. Value
About This Home
This home is located at 16 Main St Unit 1, Shrewsbury, MA 01545 and is currently estimated at $461,240, approximately $296 per square foot. 16 Main St Unit 1 is a home located in Worcester County with nearby schools including Calvin Coolidge Elementary School, Sherwood Middle School, and Oak Middle School.
Ownership History
Date
Name
Owned For
Owner Type
Purchase Details
Closed on
Jul 22, 2005
Sold by
Graham Paul D and Graham Rebecca Black
Bought by
Duvelle Philippe N
Current Estimated Value
Home Financials for this Owner
Home Financials are based on the most recent Mortgage that was taken out on this home.
Original Mortgage
$198,200
Outstanding Balance
$102,995
Interest Rate
5.59%
Mortgage Type
Purchase Money Mortgage
Estimated Equity
$358,245
Purchase Details
Closed on
May 19, 2000
Sold by
16 Main St Rt
Bought by
Graham Paul D and Black-Graham Rebecca
Purchase Details
Closed on
Oct 4, 1999
Sold by
Aames Capital Corp
Bought by
16 Main St Rt
Purchase Details
Closed on
Aug 10, 1998
Sold by
Brown Robert J
Bought by
Aames Capital Corp
Create a Home Valuation Report for This Property
The Home Valuation Report is an in-depth analysis detailing your home's value as well as a comparison with similar homes in the area
Home Values in the Area
Average Home Value in this Area
Purchase History
| Date | Buyer | Sale Price | Title Company |
|---|---|---|---|
| Duvelle Philippe N | $248,000 | -- | |
| Duvelle Philippe N | $248,000 | -- | |
| Duvelle Philippe N | $248,000 | -- | |
| Graham Paul D | $151,000 | -- | |
| Graham Paul D | $151,000 | -- | |
| 16 Main St Rt | $66,500 | -- | |
| 16 Main St Rt | $66,500 | -- | |
| Aames Capital Corp | $111,879 | -- | |
| Aames Capital Corp | $111,879 | -- |
Source: Public Records
Mortgage History
| Date | Status | Borrower | Loan Amount |
|---|---|---|---|
| Open | Duvelle Philippe N | $198,200 | |
| Closed | Duvelle Philippe N | $198,200 | |
| Previous Owner | Aames Capital Corp | $195,500 |
Source: Public Records
Tax History Compared to Growth
Tax History
| Year | Tax Paid | Tax Assessment Tax Assessment Total Assessment is a certain percentage of the fair market value that is determined by local assessors to be the total taxable value of land and additions on the property. | Land | Improvement |
|---|---|---|---|---|
| 2025 | $42 | $351,300 | $196,100 | $155,200 |
| 2024 | $4,061 | $328,000 | $186,800 | $141,200 |
| 2023 | $3,839 | $292,600 | $186,800 | $105,800 |
| 2022 | $3,544 | $251,200 | $156,600 | $94,600 |
| 2021 | $3,218 | $244,000 | $156,600 | $87,400 |
| 2020 | $3,043 | $244,000 | $156,600 | $87,400 |
| 2019 | $3,027 | $240,800 | $154,300 | $86,500 |
| 2018 | $2,998 | $236,800 | $148,300 | $88,500 |
| 2017 | $2,719 | $211,900 | $132,000 | $79,900 |
| 2016 | $2,644 | $203,400 | $118,000 | $85,400 |
| 2015 | $2,612 | $197,900 | $110,500 | $87,400 |
Source: Public Records
Map
Nearby Homes
- 1 Temple Ct
- 655 Plantation St Unit 17 Bldg B
- 56 Ireta Rd
- 5A Wigwam Hill Dr Unit A
- 64 Wauwinet Rd
- 10 Crane Cir
- 163 N Lake Ave Unit A
- 163 N Lake Ave
- 15 Eaglehead Terrace Unit 2
- 15 Eaglehead Terrace Unit 5
- 19 Eaglehead Terrace Unit 2
- 19 Eaglehead Terrace Unit 4
- 5 Fyrbeck Ave
- 7 Tern Dr
- 46 Dominion Rd
- 307 Main St
- 40 Phillips Ave
- 22 Ridge Rd
- 8 Cherry Blossom Cir Unit 50
- 276 Saint Nicholas Ave
- 16 Main St
- 18 Main St
- 12 Main St
- 12 Main St Unit B
- 12 Main St Unit A
- 17 Oakland Ave
- 17 Oakland Ave Unit B
- 19 Oakland Ave
- 22 Main St Unit 1
- 22 (Old) Main St
- 11 Oakland Ave
- 11 Oakland Ave
- 11 Oakland Ave Unit 1
- 3 Main St
- 14 Oakland Ave
- 26 Main St
- 12 Oakland Ave
- 20 Oakland Ave
- 20B Oakland Ave
- 20B Oakland Ave