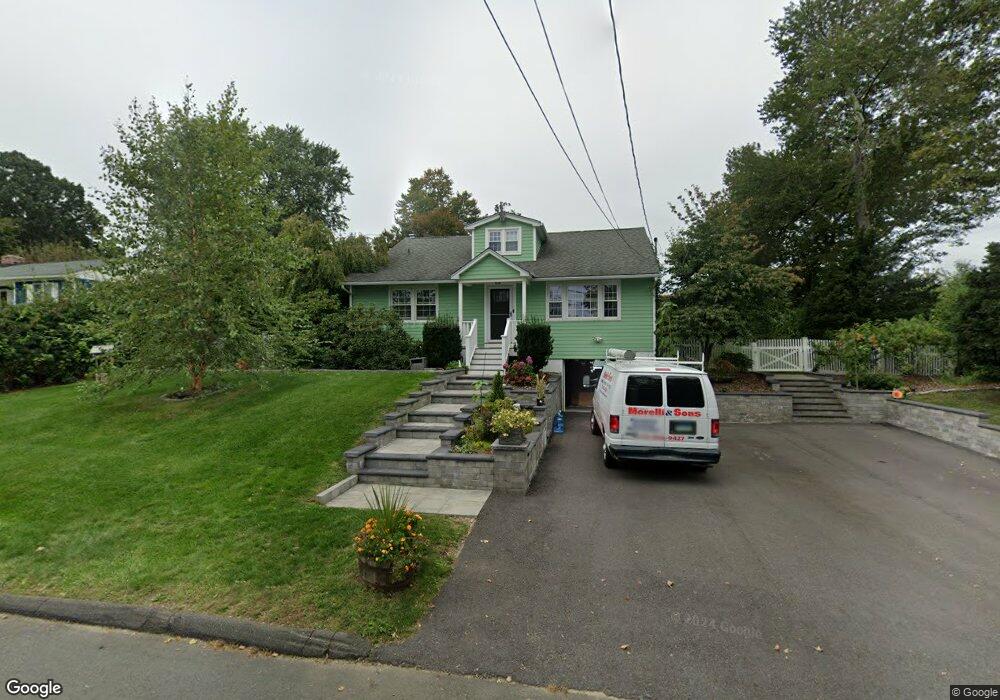
16 Manning St New Fairfield, CT 06812
Estimated Value: $450,061 - $554,000
4
Beds
2
Baths
1,843
Sq Ft
$282/Sq Ft
Est. Value
About This Home
This home is located at 16 Manning St, New Fairfield, CT 06812 and is currently estimated at $519,765, approximately $282 per square foot. 16 Manning St is a home located in Fairfield County with nearby schools including Meeting House Hill School, New Fairfield Middle School, and New Fairfield High School.
Ownership History
Date
Name
Owned For
Owner Type
Purchase Details
Closed on
Sep 20, 2006
Sold by
Stevens Frank S and Brown Sylvie L
Bought by
Vavolizza Michael S and Vavolizza Janet L
Current Estimated Value
Purchase Details
Closed on
May 9, 2001
Sold by
Kawejsza Douglas W and Kawejsza Carolyn
Bought by
Stevens Frank E and Brown Sylvie L
Purchase Details
Closed on
Apr 28, 1992
Sold by
Gilman Jerome
Bought by
Kawejsza Douglas and Purall Carolyn
Create a Home Valuation Report for This Property
The Home Valuation Report is an in-depth analysis detailing your home's value as well as a comparison with similar homes in the area
Home Values in the Area
Average Home Value in this Area
Purchase History
| Date | Buyer | Sale Price | Title Company |
|---|---|---|---|
| Vavolizza Michael S | $390,000 | -- | |
| Stevens Frank E | $239,900 | -- | |
| Kawejsza Douglas | $135,000 | -- |
Source: Public Records
Mortgage History
| Date | Status | Borrower | Loan Amount |
|---|---|---|---|
| Open | Kawejsza Douglas | $310,964 | |
| Closed | Kawejsza Douglas | $326,000 | |
| Closed | Kawejsza Douglas | $320,000 |
Source: Public Records
Tax History Compared to Growth
Tax History
| Year | Tax Paid | Tax Assessment Tax Assessment Total Assessment is a certain percentage of the fair market value that is determined by local assessors to be the total taxable value of land and additions on the property. | Land | Improvement |
|---|---|---|---|---|
| 2025 | $7,615 | $289,200 | $83,200 | $206,000 |
| 2024 | $6,270 | $171,700 | $77,500 | $94,200 |
| 2023 | $5,992 | $171,700 | $77,500 | $94,200 |
| 2022 | $5,575 | $171,700 | $77,500 | $94,200 |
| 2021 | $5,407 | $171,700 | $77,500 | $94,200 |
| 2020 | $5,251 | $171,700 | $77,500 | $94,200 |
| 2019 | $4,684 | $151,600 | $63,300 | $88,300 |
| 2018 | $4,636 | $151,600 | $63,300 | $88,300 |
| 2017 | $4,521 | $151,600 | $63,300 | $88,300 |
| 2016 | $4,348 | $151,600 | $63,300 | $88,300 |
| 2015 | $4,348 | $151,600 | $63,300 | $88,300 |
| 2014 | $4,027 | $154,400 | $70,000 | $84,400 |
Source: Public Records
Map
Nearby Homes