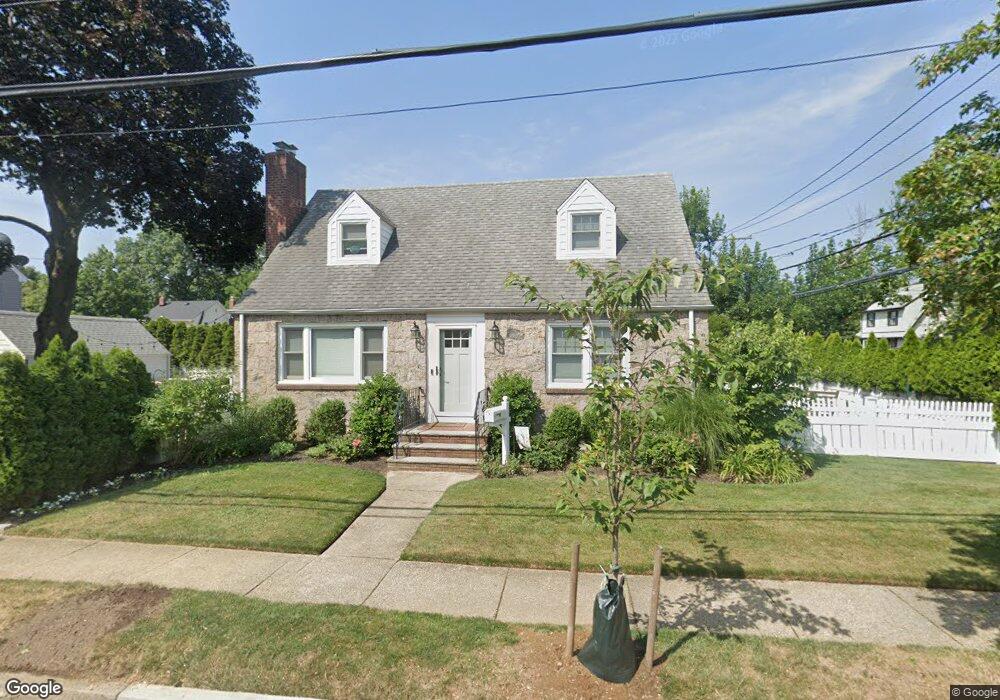
16 Maple Ave Floral Park, NY 11001
Estimated Value: $778,191 - $951,000
4
Beds
2
Baths
1,274
Sq Ft
$679/Sq Ft
Est. Value
About This Home
This home is located at 16 Maple Ave, Floral Park, NY 11001 and is currently estimated at $864,596, approximately $678 per square foot. 16 Maple Ave is a home located in Nassau County with nearby schools including Our Lady Of Victory School and St. Gregory the Great Catholic Academy of Bellerose.
Ownership History
Date
Name
Owned For
Owner Type
Purchase Details
Closed on
Apr 7, 2015
Sold by
Bedell William D and Bedell Danielle M
Bought by
Jaronczyk Christopher J
Current Estimated Value
Home Financials for this Owner
Home Financials are based on the most recent Mortgage that was taken out on this home.
Original Mortgage
$417,000
Outstanding Balance
$322,409
Interest Rate
3.86%
Mortgage Type
New Conventional
Estimated Equity
$542,187
Purchase Details
Closed on
Mar 26, 2010
Sold by
Prudential Relocation Inc
Bought by
Bedell William D and Simedira Danielle M
Home Financials for this Owner
Home Financials are based on the most recent Mortgage that was taken out on this home.
Original Mortgage
$415,000
Interest Rate
5.12%
Mortgage Type
Purchase Money Mortgage
Purchase Details
Closed on
May 18, 2007
Sold by
Winklehaus Charles
Bought by
Unger Robert
Create a Home Valuation Report for This Property
The Home Valuation Report is an in-depth analysis detailing your home's value as well as a comparison with similar homes in the area
Home Values in the Area
Average Home Value in this Area
Purchase History
| Date | Buyer | Sale Price | Title Company |
|---|---|---|---|
| Jaronczyk Christopher J | $529,000 | Judicial Title Insurance | |
| Bedell William D | $490,000 | -- | |
| Prudential Relocation Inc | $490,000 | -- | |
| Unger Robert | $490,000 | -- |
Source: Public Records
Mortgage History
| Date | Status | Borrower | Loan Amount |
|---|---|---|---|
| Open | Jaronczyk Christopher J | $417,000 | |
| Previous Owner | Prudential Relocation Inc | $415,000 |
Source: Public Records
Tax History Compared to Growth
Tax History
| Year | Tax Paid | Tax Assessment Tax Assessment Total Assessment is a certain percentage of the fair market value that is determined by local assessors to be the total taxable value of land and additions on the property. | Land | Improvement |
|---|---|---|---|---|
| 2025 | $8,948 | $532 | $293 | $239 |
| 2024 | $1,156 | $556 | $306 | $250 |
| 2023 | $8,202 | $563 | $268 | $295 |
| 2022 | $8,202 | $590 | $325 | $265 |
| 2021 | $12,326 | $567 | $312 | $255 |
| 2020 | $7,900 | $751 | $750 | $1 |
| 2019 | $8,294 | $751 | $750 | $1 |
| 2018 | $7,756 | $751 | $0 | $0 |
| 2017 | $5,929 | $751 | $750 | $1 |
| 2016 | $7,014 | $795 | $654 | $141 |
| 2015 | $1,121 | $839 | $690 | $149 |
| 2014 | $1,121 | $839 | $690 | $149 |
| 2013 | $1,214 | $990 | $814 | $176 |
Source: Public Records
Map
Nearby Homes
- 84 Superior Rd
- 88 Mayfair Ave
- 22 Pansy Ave
- 10 Pansy Ave
- 19 Superior Rd
- 15 Superior Rd
- 78 Ontario Rd
- 103 Calla Ave
- 104 Geranium Ave
- 2 Michigan Rd
- 20 Geranium Ave
- 1 Childs Ave Unit 1E
- 43 Floral Blvd Unit 1C
- 37 Massachusetts Blvd
- 9257 246th St
- 5 Adelaide St Unit B1 D2
- 5 Adelaide St Unit B2D1
- 247-23 91st Ave
- 9240 245th St
- 248-30 88th Dr