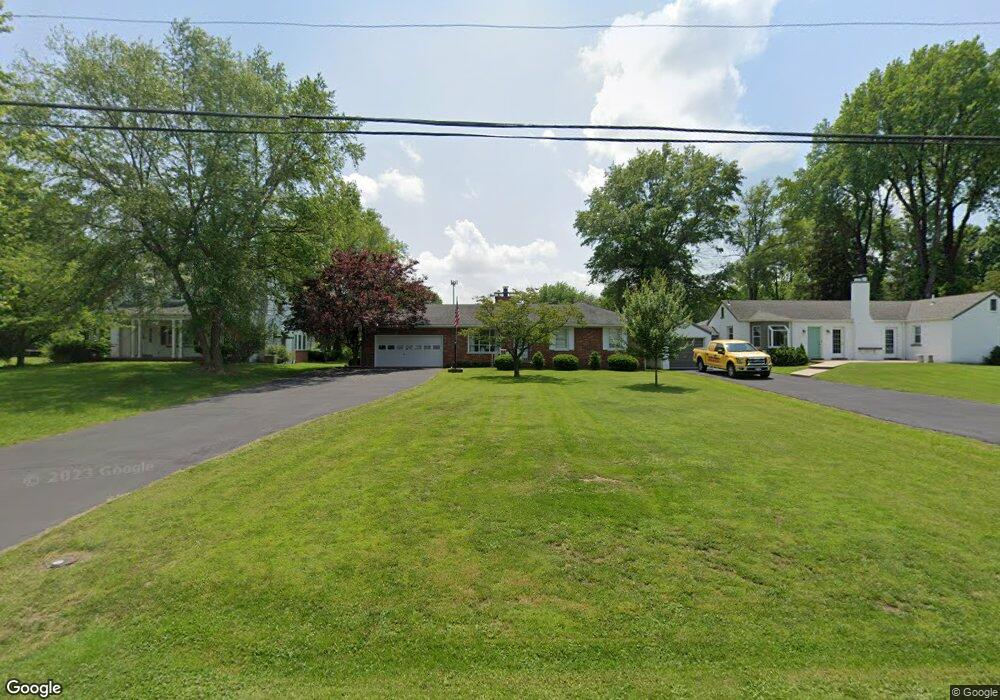
16 Maple Dr Belleville, IL 62220
Estimated Value: $135,000 - $187,604
Studio
--
Bath
1,152
Sq Ft
$146/Sq Ft
Est. Value
About This Home
This home is located at 16 Maple Dr, Belleville, IL 62220 and is currently estimated at $167,901, approximately $145 per square foot. 16 Maple Dr is a home located in St. Clair County with nearby schools including Westhaven Elementary School, Central Jr High School, and Notre Dame Academy of Belleville.
Ownership History
Date
Name
Owned For
Owner Type
Purchase Details
Closed on
Oct 25, 2023
Sold by
Wolf Debra A
Bought by
Wolf Drew Kayla and Wolf Kelsey Marie
Current Estimated Value
Home Financials for this Owner
Home Financials are based on the most recent Mortgage that was taken out on this home.
Original Mortgage
$137,500
Outstanding Balance
$134,172
Interest Rate
6%
Mortgage Type
New Conventional
Estimated Equity
$33,729
Purchase Details
Closed on
Jun 1, 2023
Sold by
Becker Dale M and Jeanette R Becker Revocable Living Trust Jean
Bought by
Wolf Debra A
Home Financials for this Owner
Home Financials are based on the most recent Mortgage that was taken out on this home.
Original Mortgage
$131,875
Interest Rate
6.43%
Mortgage Type
New Conventional
Purchase Details
Closed on
May 13, 2005
Sold by
Becker Melvin J and Becker Jeanette R
Bought by
Becker Melvin J and Becker Jeanette R
Create a Home Valuation Report for This Property
The Home Valuation Report is an in-depth analysis detailing your home's value as well as a comparison with similar homes in the area
Home Values in the Area
Average Home Value in this Area
Purchase History
| Date | Buyer | Sale Price | Title Company |
|---|---|---|---|
| Wolf Drew Kayla | $137,500 | None Available | |
| Wolf Debra A | $137,500 | Community Title | |
| Becker Melvin J | -- | -- |
Source: Public Records
Mortgage History
| Date | Status | Borrower | Loan Amount |
|---|---|---|---|
| Open | Wolf Drew Kayla | $137,500 | |
| Previous Owner | Wolf Debra A | $131,875 |
Source: Public Records
Tax History
| Year | Tax Paid | Tax Assessment Tax Assessment Total Assessment is a certain percentage of the fair market value that is determined by local assessors to be the total taxable value of land and additions on the property. | Land | Improvement |
|---|---|---|---|---|
| 2024 | $3,717 | $49,947 | $8,516 | $41,431 |
| 2023 | $984 | $45,206 | $8,399 | $36,807 |
| 2022 | $1,009 | $41,171 | $7,649 | $33,522 |
| 2021 | $1,040 | $39,481 | $7,335 | $32,146 |
| 2020 | $1,049 | $36,768 | $6,831 | $29,937 |
| 2019 | $1,056 | $36,015 | $6,971 | $29,044 |
| 2018 | $1,066 | $35,095 | $6,793 | $28,302 |
| 2017 | $1,071 | $34,160 | $6,612 | $27,548 |
| 2016 | $1,078 | $32,982 | $6,384 | $26,598 |
| 2014 | $990 | $32,312 | $6,425 | $25,887 |
| 2013 | $997 | $32,312 | $6,425 | $25,887 |
Source: Public Records
Map
Nearby Homes
- 91-110 Westhaven Meadows Dr
- 2058 Celebration Park Cir
- 2067 Celebration Park Cir
- 1933 Celebration Park Cir
- 1500 State Street Rd
- 2049 Park Rd
- 248 Harmony Ridge Dr
- 34 Lake Forest Dr
- 2030 Woodsong Way Ln
- 225 Kenley Ct
- 225 River Laurel Dr
- 403 S Belt W
- 1012 S Church St
- 403 W Van Buren St
- 923 S High St
- 818 S Jackson St
- 815 S Charles St
- 321 S Jackson St
- 516 Springwood Dr
- 218 Winterberry Dr
- 12 Maple Dr
- 24 Maple Dr
- 8 Maple Dr
- 28 Maple Dr
- 24 Westhaven Meadows Dr
- 20 Westhaven Meadows Dr
- 28 Westhaven Meadows Dr
- 6 Maple Dr
- 16 Westhaven Meadows Dr
- 32 Maple Dr
- 32 Westhaven Meadows Dr
- 0 Westhaven Meadows Dr Unit MAR24023307
- 34 Maple Dr
- 36 Westhaven Meadows Dr
- 36 Maple Dr
- 1705 S Illinois St
- 4 Maple Dr
- 23 Westhaven Meadows Dr
- 19 Westhaven Meadows Dr
Your Personal Tour Guide
Ask me questions while you tour the home.