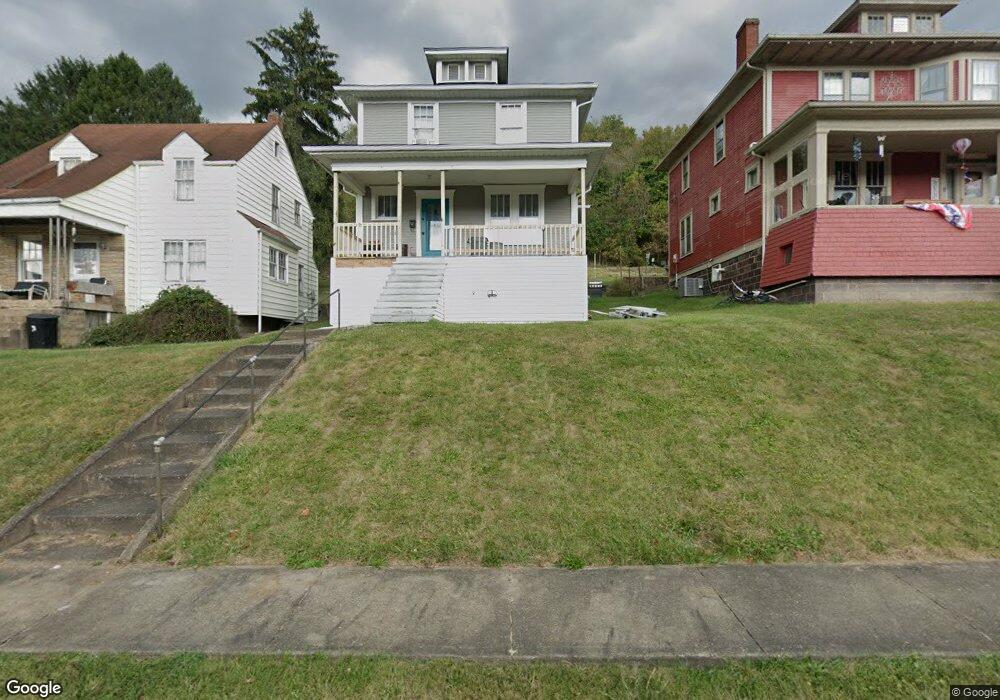
16 Maple St Bridgeport, OH 43912
Estimated Value: $84,000 - $102,000
2
Beds
2
Baths
1,216
Sq Ft
$75/Sq Ft
Est. Value
About This Home
This home is located at 16 Maple St, Bridgeport, OH 43912 and is currently estimated at $90,758, approximately $74 per square foot. 16 Maple St is a home located in Belmont County with nearby schools including Bridgeport Elementary School, Bridgeport Middle School, and Bridgeport High School.
Ownership History
Date
Name
Owned For
Owner Type
Purchase Details
Closed on
Dec 23, 2021
Sold by
Jones Brittany N and Pittner Brittany N
Bought by
Berk Wayne
Current Estimated Value
Purchase Details
Closed on
Apr 23, 2010
Sold by
Wetzel James Robert and Wetzel Martin Stephen
Bought by
Pittner Brittany N
Home Financials for this Owner
Home Financials are based on the most recent Mortgage that was taken out on this home.
Original Mortgage
$40,306
Interest Rate
5.3%
Mortgage Type
New Conventional
Purchase Details
Closed on
Aug 23, 1999
Sold by
Wetzel James Robert and Wetzel Mar
Bought by
Wetzel James Robert and Wetzel Mar
Purchase Details
Closed on
Jan 1, 1986
Sold by
Wetzel Mary R
Bought by
Wetzel Mary R
Create a Home Valuation Report for This Property
The Home Valuation Report is an in-depth analysis detailing your home's value as well as a comparison with similar homes in the area
Purchase History
| Date | Buyer | Sale Price | Title Company |
|---|---|---|---|
| Berk Wayne | $62,000 | Northwest Ttl Fam Of Compani | |
| Pittner Brittany N | $38,000 | Attorney | |
| Wetzel James Robert | -- | -- | |
| Wetzel Mary R | -- | -- |
Source: Public Records
Mortgage History
| Date | Status | Borrower | Loan Amount |
|---|---|---|---|
| Previous Owner | Pittner Brittany N | $40,306 |
Source: Public Records
Tax History
| Year | Tax Paid | Tax Assessment Tax Assessment Total Assessment is a certain percentage of the fair market value that is determined by local assessors to be the total taxable value of land and additions on the property. | Land | Improvement |
|---|---|---|---|---|
| 2025 | $1,020 | $26,440 | $3,320 | $23,120 |
| 2023 | $1,082 | $25,800 | $3,320 | $22,480 |
| 2022 | $1,081 | $25,795 | $3,318 | $22,477 |
| 2021 | $1,094 | $25,795 | $3,318 | $22,477 |
| 2020 | $1,453 | $22,590 | $2,880 | $19,710 |
| 2019 | $1,184 | $22,590 | $2,880 | $19,710 |
| 2018 | $1,106 | $22,590 | $2,880 | $19,710 |
| 2017 | $635 | $18,680 | $3,250 | $15,430 |
| 2016 | $1,246 | $18,680 | $3,250 | $15,430 |
| 2015 | $982 | $18,680 | $3,250 | $15,430 |
| 2014 | $870 | $18,850 | $2,950 | $15,900 |
| 2013 | $441 | $18,850 | $2,950 | $15,900 |
Source: Public Records
Map
Nearby Homes
- 4 Walnut Ave
- 13 Prospect St
- 26 Elm St
- 836 Main St
- 56316 National Rd
- 44 Mann St
- 806 Howard St
- 822 W Bennett St
- 56065 National Rd
- 67457 Kirkwood Heights Rd
- 67478 Kirkwood Heights Rd
- 67471 Kirkwood Heights Rd
- 422 Whitely St
- 55935 Main St
- 413 Bennett St
- 69142 Woods Rd
- 67540 Kirkwood Heights Rd
- 67531 Kirkwood Heights Rd
- 244 Lombardy Heights
- 308 Whitely St
Your Personal Tour Guide
Ask me questions while you tour the home.