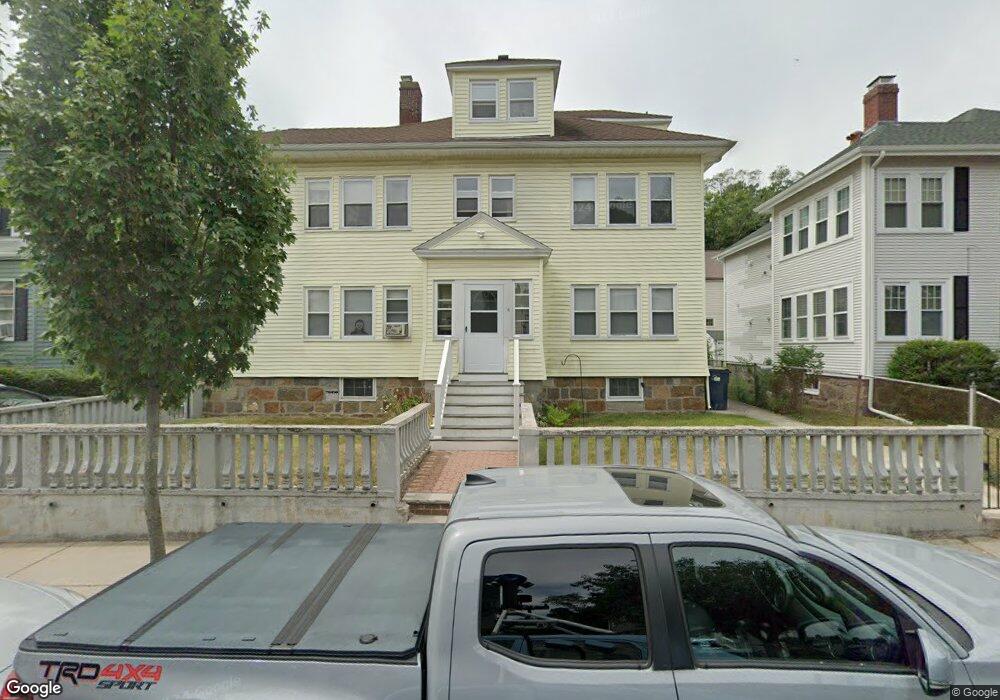
16 Maple St West Roxbury, MA 02132
West Roxbury NeighborhoodEstimated Value: $918,741 - $1,477,000
7
Beds
3
Baths
3,611
Sq Ft
$340/Sq Ft
Est. Value
About This Home
This home is located at 16 Maple St, West Roxbury, MA 02132 and is currently estimated at $1,227,435, approximately $339 per square foot. 16 Maple St is a home located in Suffolk County with nearby schools including Holy Name Parish School, St Theresa School, and The Roxbury Latin School.
Ownership History
Date
Name
Owned For
Owner Type
Purchase Details
Closed on
Oct 1, 2025
Sold by
Hill Seamus
Bought by
Seamus A Hill T A and Seamus Hill
Current Estimated Value
Purchase Details
Closed on
May 30, 1996
Sold by
Kazis Ft and Kazis
Bought by
Hill Seamus and Hill Olive
Create a Home Valuation Report for This Property
The Home Valuation Report is an in-depth analysis detailing your home's value as well as a comparison with similar homes in the area
Home Values in the Area
Average Home Value in this Area
Purchase History
| Date | Buyer | Sale Price | Title Company |
|---|---|---|---|
| Seamus A Hill T A | -- | -- | |
| Hill Seamus | $236,200 | -- |
Source: Public Records
Mortgage History
| Date | Status | Borrower | Loan Amount |
|---|---|---|---|
| Previous Owner | Hill Seamus | $166,678 | |
| Previous Owner | Hill Seamus | $100,000 | |
| Previous Owner | Hill Seamus | $195,630 |
Source: Public Records
Tax History
| Year | Tax Paid | Tax Assessment Tax Assessment Total Assessment is a certain percentage of the fair market value that is determined by local assessors to be the total taxable value of land and additions on the property. | Land | Improvement |
|---|---|---|---|---|
| 2025 | $14,613 | $1,261,900 | $329,900 | $932,000 |
| 2024 | $12,642 | $1,159,800 | $352,100 | $807,700 |
| 2023 | $12,099 | $1,126,500 | $342,000 | $784,500 |
| 2022 | $11,668 | $1,072,400 | $325,600 | $746,800 |
| 2021 | $11,110 | $1,041,200 | $316,100 | $725,100 |
| 2020 | $10,191 | $965,100 | $299,700 | $665,400 |
| 2019 | $9,592 | $910,100 | $243,000 | $667,100 |
| 2018 | $8,830 | $842,600 | $243,000 | $599,600 |
| 2017 | $8,494 | $802,100 | $243,000 | $559,100 |
| 2016 | $8,246 | $749,600 | $243,000 | $506,600 |
| 2015 | $7,656 | $632,200 | $198,900 | $433,300 |
| 2014 | $7,426 | $590,300 | $198,900 | $391,400 |
Source: Public Records
Map
Nearby Homes
- 72 Redlands Rd
- 55 Redlands Rd
- 37 Hastings St Unit 201
- 17 Hastings St Unit 5
- 72-74 Manthorne Rd Unit 74
- 32 Russett Rd
- 104 Greaton Rd
- 96 Theodore Parker Rd
- 24 Rhoda St
- 205 Park St Unit 2
- 4 Anawan Ave Unit 7
- 37 Pelton St
- 150 Tyndale St Unit 2
- 425 Lagrange St Unit 203
- 73 Dent St Unit 2
- 281 Belgrade Ave Unit 2
- 348 Lagrange St
- 118-120 Tyndale St
- 62 Ainsworth St
- 73 Woodard Rd
- 16 Maple St Unit 2
- 20 Maple St
- 20 Maple St Unit 2
- 4 Graham Terrace
- 46 Graham Terrace
- 12 Maple St
- 22 Maple St
- 8 Graham Terrace Unit 10
- 10 Graham Terrace Unit 10
- 24 Maple St
- 24 Maple St Unit 24
- 24 Maple St
- 24 Maple St Unit 2
- 9 Maple St
- 23 Maple St
- 15 Maple St
- 5 Maple St
- 19 Maple St
- 5 Graham Terrace Unit 1
- 5 Graham Terrace
Your Personal Tour Guide
Ask me questions while you tour the home.