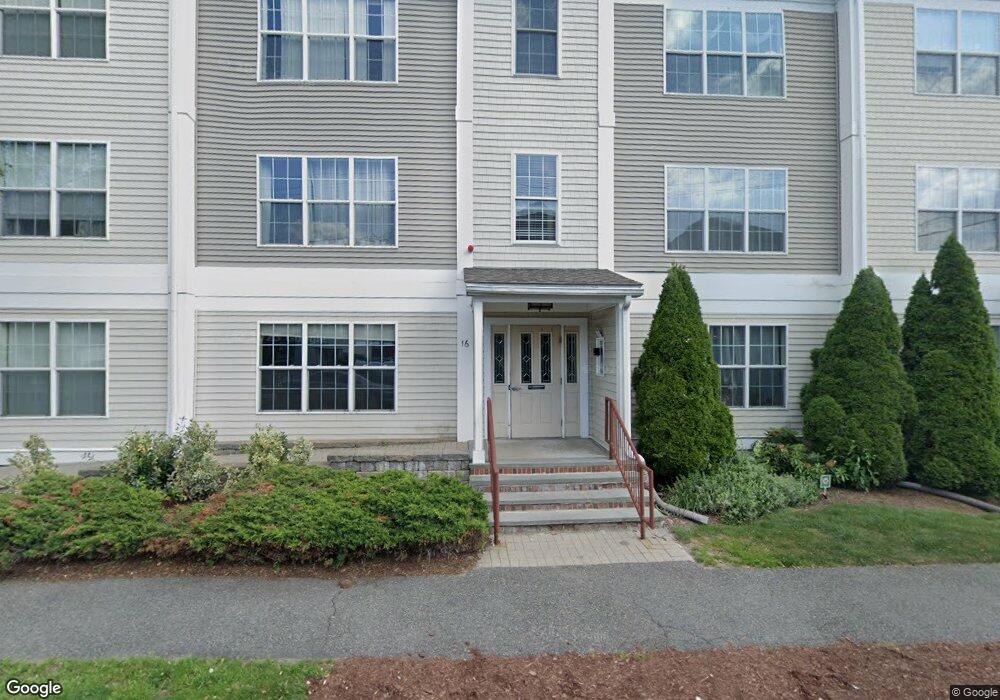
16 Margin St Unit 4 Lynn, MA 01905
Austin Square NeighborhoodEstimated Value: $439,578 - $535,000
3
Beds
2
Baths
1,250
Sq Ft
$379/Sq Ft
Est. Value
About This Home
This home is located at 16 Margin St Unit 4, Lynn, MA 01905 and is currently estimated at $473,645, approximately $378 per square foot. 16 Margin St Unit 4 is a home located in Essex County with nearby schools including North Park Elementary School, Drewicz Elementary School, and William R. Fallon School.
Ownership History
Date
Name
Owned For
Owner Type
Purchase Details
Closed on
May 3, 2021
Sold by
Brown Devin J and Brown Joseph J
Bought by
Brown Devin and Obrien Stephen
Current Estimated Value
Home Financials for this Owner
Home Financials are based on the most recent Mortgage that was taken out on this home.
Original Mortgage
$252,000
Outstanding Balance
$227,401
Interest Rate
3.1%
Mortgage Type
New Conventional
Estimated Equity
$246,244
Purchase Details
Closed on
Oct 20, 2006
Sold by
Corcoran Brothers Dev
Bought by
Brown Joseph J and Brown Devin J
Home Financials for this Owner
Home Financials are based on the most recent Mortgage that was taken out on this home.
Original Mortgage
$256,900
Interest Rate
6.49%
Mortgage Type
Purchase Money Mortgage
Create a Home Valuation Report for This Property
The Home Valuation Report is an in-depth analysis detailing your home's value as well as a comparison with similar homes in the area
Home Values in the Area
Average Home Value in this Area
Purchase History
| Date | Buyer | Sale Price | Title Company |
|---|---|---|---|
| Brown Devin | -- | None Available | |
| Brown Devin | -- | None Available | |
| Brown Devin | -- | None Available | |
| Brown Devin | -- | None Available | |
| Brown Joseph J | $256,900 | -- | |
| Brown Joseph J | $256,900 | -- |
Source: Public Records
Mortgage History
| Date | Status | Borrower | Loan Amount |
|---|---|---|---|
| Open | Brown Devin | $252,000 | |
| Closed | Brown Devin | $252,000 | |
| Previous Owner | Brown Joseph J | $256,900 |
Source: Public Records
Tax History Compared to Growth
Tax History
| Year | Tax Paid | Tax Assessment Tax Assessment Total Assessment is a certain percentage of the fair market value that is determined by local assessors to be the total taxable value of land and additions on the property. | Land | Improvement |
|---|---|---|---|---|
| 2025 | $4,069 | $392,800 | $0 | $392,800 |
| 2024 | $4,002 | $380,100 | $0 | $380,100 |
| 2023 | $3,820 | $342,600 | $0 | $342,600 |
| 2022 | $4,107 | $330,400 | $0 | $330,400 |
| 2021 | $3,608 | $276,900 | $0 | $276,900 |
| 2020 | $3,755 | $280,200 | $0 | $280,200 |
| 2019 | $3,852 | $269,400 | $0 | $269,400 |
| 2018 | $3,598 | $235,600 | $0 | $235,600 |
| 2017 | $3,566 | $228,600 | $0 | $228,600 |
| 2016 | $3,441 | $212,700 | $0 | $212,700 |
| 2015 | $2,573 | $153,600 | $0 | $153,600 |
Source: Public Records
Map
Nearby Homes
- 28 Margin St Unit A
- 3 River Street Ct
- 9 Needhams Landing
- 86 Laurel St
- 79 Laurel St
- 14 River Street Place
- 16 River St Unit 6
- 16 Linden St
- 100 Ashland St
- 45 Cottage St Unit 3
- 20 Houston St
- 29 Fenton Ave
- 20 Murray St
- 19 Hood St
- 725 Boston St
- 8 Ray St
- 35 Curran Rd
- 28 Wyman St
- 92-94 Newton Ave
- 9 Spencer Ave
- 16 Margin St Unit 12
- 16 Margin St Unit 11
- 16 Margin St Unit 10
- 16 Margin St Unit 9
- 16 Margin St Unit 8
- 16 Margin St Unit 7
- 16 Margin St Unit 6
- 16 Margin St Unit 5
- 16 Margin St Unit 3
- 16 Margin St Unit 2
- 16 Margin St Unit 1
- 16 Margin St Unit 1B
- 24 Margin St Unit E
- 24 Margin St Unit D
- 24 Margin St Unit C
- 24 Margin St Unit B
- 24 Margin St Unit A
- 24 Margin St Unit 24D
- 10 Margin St
- 17 Margin St Unit 22