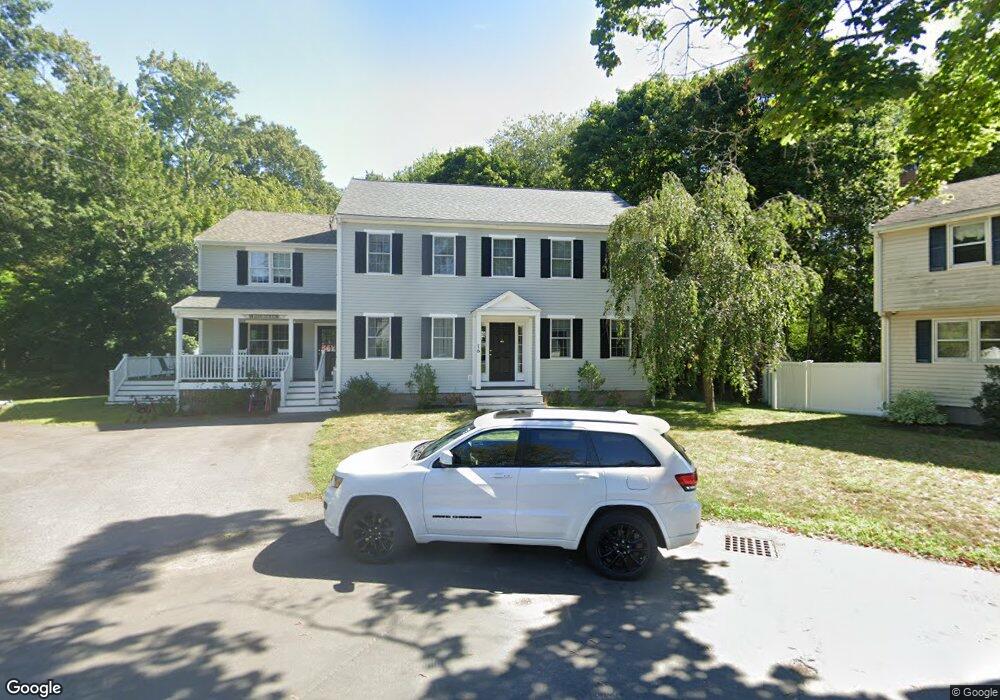
16 Marshall Rd Hingham, MA 02043
Estimated Value: $1,357,000 - $1,702,774
3
Beds
4
Baths
2,930
Sq Ft
$508/Sq Ft
Est. Value
About This Home
This home is located at 16 Marshall Rd, Hingham, MA 02043 and is currently estimated at $1,488,194, approximately $507 per square foot. 16 Marshall Rd is a home located in Plymouth County with nearby schools including East Elementary School, Hingham Middle School, and Hingham High School.
Ownership History
Date
Name
Owned For
Owner Type
Purchase Details
Closed on
Sep 12, 2018
Sold by
Stevens Marshall Road
Bought by
Marshall Road T
Current Estimated Value
Purchase Details
Closed on
Sep 30, 1998
Sold by
Mclaughlin Lee W and Mclaughlin Laura G
Bought by
Stevens Andrew P and Bittner Nicole E
Home Financials for this Owner
Home Financials are based on the most recent Mortgage that was taken out on this home.
Original Mortgage
$179,000
Interest Rate
6.89%
Mortgage Type
Purchase Money Mortgage
Purchase Details
Closed on
Aug 23, 1996
Sold by
Willwerth Paul F and Willwerth Dawn A
Bought by
Mclaughlin Lee W and Mclaughlin Laura G
Create a Home Valuation Report for This Property
The Home Valuation Report is an in-depth analysis detailing your home's value as well as a comparison with similar homes in the area
Purchase History
| Date | Buyer | Sale Price | Title Company |
|---|---|---|---|
| Marshall Road T | $430,000 | -- | |
| Stevens Marshall Road | -- | -- | |
| Stevens Andrew P | $223,750 | -- | |
| Mclaughlin Lee W | $169,000 | -- |
Source: Public Records
Mortgage History
| Date | Status | Borrower | Loan Amount |
|---|---|---|---|
| Previous Owner | Mclaughlin Lee W | $222,000 | |
| Previous Owner | Mclaughlin Lee W | $161,000 | |
| Previous Owner | Mclaughlin Lee W | $60,000 | |
| Previous Owner | Mclaughlin Lee W | $179,000 |
Source: Public Records
Tax History
| Year | Tax Paid | Tax Assessment Tax Assessment Total Assessment is a certain percentage of the fair market value that is determined by local assessors to be the total taxable value of land and additions on the property. | Land | Improvement |
|---|---|---|---|---|
| 2025 | $13,879 | $1,298,300 | $519,500 | $778,800 |
| 2024 | $12,487 | $1,150,900 | $519,500 | $631,400 |
| 2023 | $10,786 | $1,078,600 | $519,500 | $559,100 |
| 2022 | $10,188 | $881,300 | $432,800 | $448,500 |
| 2021 | $9,952 | $843,400 | $432,800 | $410,600 |
| 2020 | $6,057 | $525,300 | $432,800 | $92,500 |
| 2019 | $8,501 | $491,500 | $380,900 | $110,600 |
| 2018 | $5,627 | $478,100 | $380,900 | $97,200 |
| 2017 | $6,038 | $492,900 | $367,900 | $125,000 |
| 2016 | $5,936 | $475,300 | $350,300 | $125,000 |
| 2015 | $4,759 | $379,800 | $254,800 | $125,000 |
Source: Public Records
Map
Nearby Homes
Your Personal Tour Guide
Ask me questions while you tour the home.