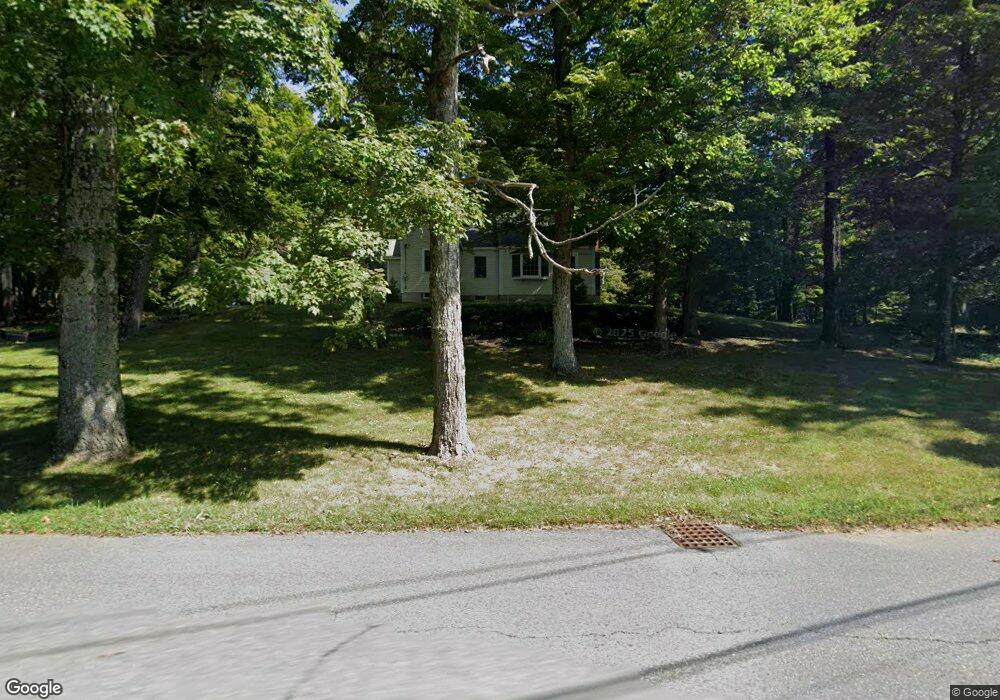
16 Mason St Pepperell, MA 01463
Estimated Value: $452,000 - $549,000
2
Beds
2
Baths
720
Sq Ft
$694/Sq Ft
Est. Value
About This Home
This home is located at 16 Mason St, Pepperell, MA 01463 and is currently estimated at $499,780, approximately $694 per square foot. 16 Mason St is a home located in Middlesex County with nearby schools including North Middlesex Regional High School, Pepperell Christian Academy, and Maple Dene & Moppet School.
Ownership History
Date
Name
Owned For
Owner Type
Purchase Details
Closed on
Apr 15, 2015
Sold by
Blood John C and Blood Kim M
Bought by
John C Blood Int
Current Estimated Value
Purchase Details
Closed on
Mar 10, 2009
Sold by
Blood John H
Bought by
Blood Ft
Purchase Details
Closed on
Feb 19, 2009
Sold by
Blood John Harland
Bought by
Blood Ft
Purchase Details
Closed on
Oct 27, 2008
Sold by
Blood John C
Bought by
Blood John C and Blood Kim M
Home Financials for this Owner
Home Financials are based on the most recent Mortgage that was taken out on this home.
Original Mortgage
$224,900
Interest Rate
5.94%
Mortgage Type
Purchase Money Mortgage
Create a Home Valuation Report for This Property
The Home Valuation Report is an in-depth analysis detailing your home's value as well as a comparison with similar homes in the area
Home Values in the Area
Average Home Value in this Area
Purchase History
| Date | Buyer | Sale Price | Title Company |
|---|---|---|---|
| John C Blood Int | -- | -- | |
| Blood Ft | -- | -- | |
| Blood Ft | -- | -- | |
| Blood John C | -- | -- |
Source: Public Records
Mortgage History
| Date | Status | Borrower | Loan Amount |
|---|---|---|---|
| Previous Owner | Blood John C | $224,900 |
Source: Public Records
Tax History Compared to Growth
Tax History
| Year | Tax Paid | Tax Assessment Tax Assessment Total Assessment is a certain percentage of the fair market value that is determined by local assessors to be the total taxable value of land and additions on the property. | Land | Improvement |
|---|---|---|---|---|
| 2025 | $5,887 | $402,400 | $169,600 | $232,800 |
| 2024 | $5,542 | $386,200 | $153,400 | $232,800 |
| 2023 | $5,269 | $348,000 | $129,400 | $218,600 |
| 2022 | $5,363 | $312,700 | $129,100 | $183,600 |
| 2021 | $5,215 | $291,000 | $113,100 | $177,900 |
| 2020 | $4,989 | $293,800 | $113,100 | $180,700 |
| 2019 | $4,463 | $269,000 | $113,100 | $155,900 |
| 2018 | $4,271 | $260,600 | $113,100 | $147,500 |
| 2017 | $4,103 | $258,200 | $113,100 | $145,100 |
| 2016 | $3,992 | $241,500 | $113,100 | $128,400 |
| 2015 | $3,852 | $241,500 | $113,100 | $128,400 |
| 2014 | $3,751 | $236,500 | $113,100 | $123,400 |
Source: Public Records
Map
Nearby Homes
- 6 Mason St Unit 59
- 35 Mount Lebanon St
- 7 Birch Hill Rd
- 7 Elm St
- 68 Mount Lebanon St
- 22 River Rd
- 38 River Rd Unit 11
- 12 Chace Ave
- 19 Sartelle St
- 25 Chace Ave
- 17 Chace Ave
- 103 Main St Unit 23
- 16 Village Rd
- 10 Tucker St
- 8 Tucker Park Unit D
- 126 Shirley St Unit 128
- 5 Friends Way
- 3 Nashua Rd
- 181A South Rd
- 46 Brookline St