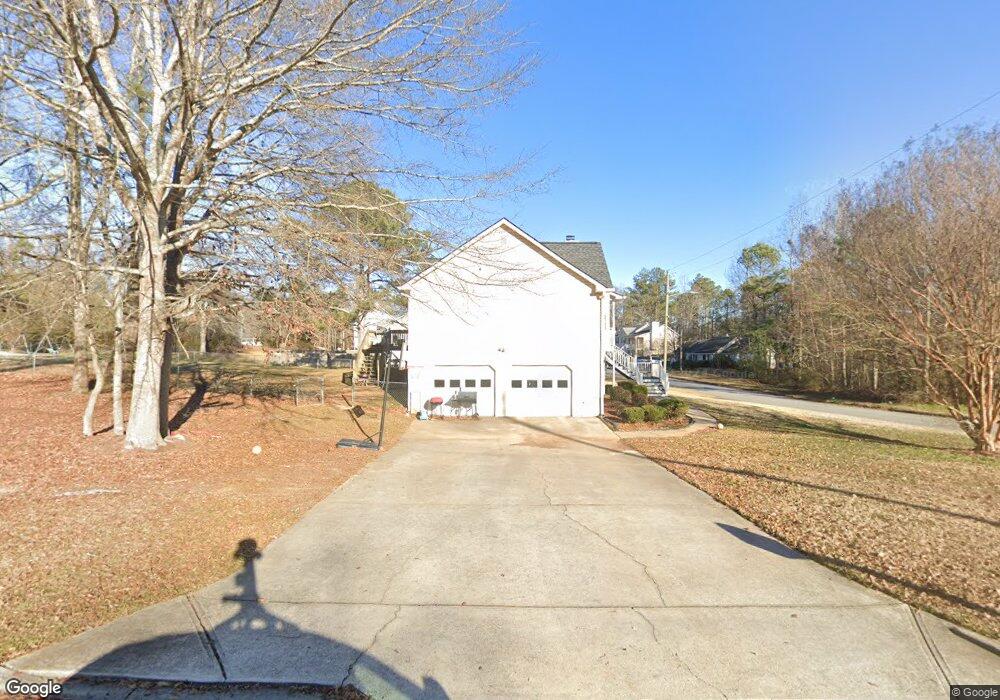
16 Matthews Place Unit 16 Temple, GA 30179
Estimated Value: $263,000 - $298,000
5
Beds
2
Baths
1,379
Sq Ft
$201/Sq Ft
Est. Value
About This Home
This home is located at 16 Matthews Place Unit 16, Temple, GA 30179 and is currently estimated at $277,380, approximately $201 per square foot. 16 Matthews Place Unit 16 is a home located in Paulding County with nearby schools including Union Elementary School, Carl Scoggins Sr. Middle School, and South Paulding High School.
Ownership History
Date
Name
Owned For
Owner Type
Purchase Details
Closed on
Aug 28, 2015
Sold by
Quinn Timothy Brandon Scott
Bought by
Quinn Timothy Brandon Scott and Quinn Rachel L
Current Estimated Value
Home Financials for this Owner
Home Financials are based on the most recent Mortgage that was taken out on this home.
Original Mortgage
$80,000
Outstanding Balance
$63,070
Interest Rate
4.02%
Mortgage Type
New Conventional
Estimated Equity
$214,310
Purchase Details
Closed on
Jan 24, 2003
Sold by
S R Golden Homes Inc
Bought by
Long Stephen J and Long Latrina
Home Financials for this Owner
Home Financials are based on the most recent Mortgage that was taken out on this home.
Original Mortgage
$24,200
Interest Rate
5.89%
Mortgage Type
New Conventional
Create a Home Valuation Report for This Property
The Home Valuation Report is an in-depth analysis detailing your home's value as well as a comparison with similar homes in the area
Home Values in the Area
Average Home Value in this Area
Purchase History
| Date | Buyer | Sale Price | Title Company |
|---|---|---|---|
| Quinn Timothy Brandon Scott | -- | -- | |
| Quinn Timothy Brandon Scott | $118,900 | -- | |
| Long Stephen J | $119,900 | -- |
Source: Public Records
Mortgage History
| Date | Status | Borrower | Loan Amount |
|---|---|---|---|
| Open | Quinn Timothy Brandon Scott | $80,000 | |
| Closed | Quinn Timothy Brandon Scott | $80,000 | |
| Previous Owner | Long Stephen J | $24,200 |
Source: Public Records
Tax History Compared to Growth
Tax History
| Year | Tax Paid | Tax Assessment Tax Assessment Total Assessment is a certain percentage of the fair market value that is determined by local assessors to be the total taxable value of land and additions on the property. | Land | Improvement |
|---|---|---|---|---|
| 2024 | $2,811 | $116,236 | $12,000 | $104,236 |
| 2023 | $2,783 | $109,280 | $12,000 | $97,280 |
| 2022 | $2,816 | $94,800 | $12,000 | $82,800 |
| 2021 | $2,067 | $69,596 | $8,000 | $61,596 |
| 2020 | $1,983 | $68,636 | $8,000 | $60,636 |
| 2019 | $1,543 | $53,060 | $8,000 | $45,060 |
| 2018 | $1,539 | $52,948 | $8,000 | $44,948 |
| 2017 | $1,398 | $47,632 | $8,000 | $39,632 |
| 2016 | $1,360 | $46,840 | $8,000 | $38,840 |
| 2015 | $1,107 | $35,956 | $8,000 | $27,956 |
| 2014 | $1,088 | $34,468 | $8,000 | $26,468 |
| 2013 | -- | $26,760 | $8,000 | $18,760 |
Source: Public Records
Map
Nearby Homes
- 508 Millertown Rd
- 59 Mullberry Path
- 703 Mulberry Rock Rd
- 723 Mulberry Rock Rd
- 728 Harmony Rd
- 00 Billy Bullock Rd
- 270 Harmony Woods Dr
- 281 Harmony Woods Dr
- 292 Harmony Woods Dr
- 00002 Boulder View Pkwy
- 34 Harmony Ridge Dr
- 453 Mulberry Rock Rd
- 391 Mulberry Rock Rd
- 8713 Buchanan Hwy
- 104 Federal Path
- 460 Pleasant Way
- 957 Georgia 101
- 959 Georgia 101
- 15 Quarry Ln
- 221 Pleasant Way
- 16 Matthews Place
- 16 Matthews Place Unit 500.00
- 16 Matthews Place
- 91 Gilberts Way
- 46 Matthews Place
- 54 Gilberts Way
- 17 Matthews Place
- 50 Matthews Place
- 39 Matthews Place
- 17 Makayla Way Unit LOT 8
- 17 Makayla Way
- 17 Makayla Way
- 17 Makayla Way Unit 17
- 49 Matthews St Unit 49
- 32 Gilberts Way
- 49 Matthews Place
- 118 Gilberts Way
- 98 Gilberts Way
- 12 Gilberts Way
- 61 Makayla Way