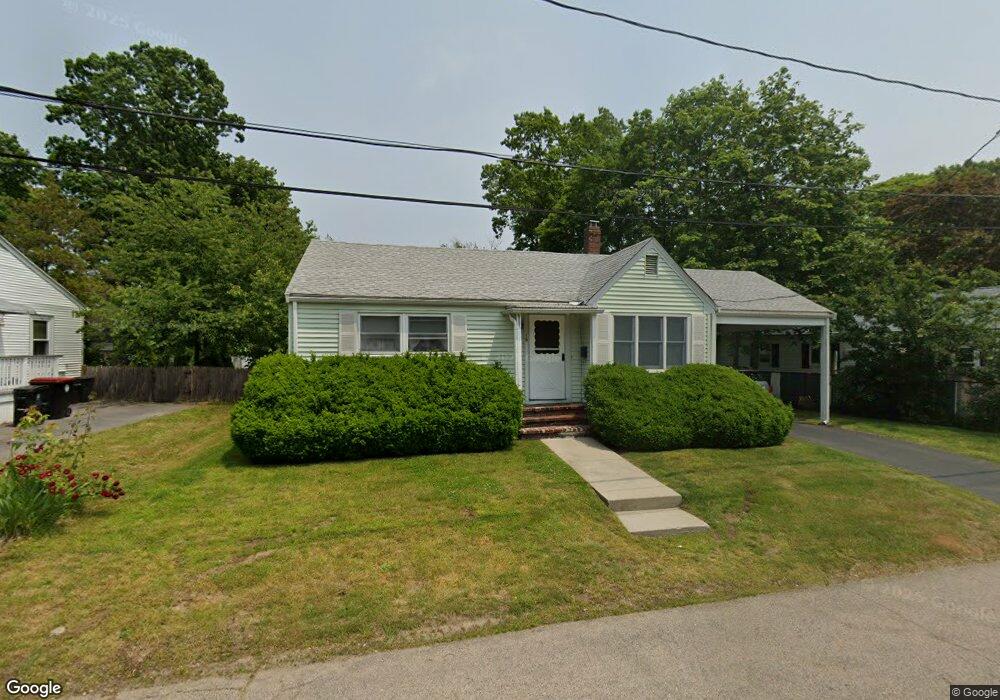
16 Menlo Ave Brockton, MA 02301
Clifton Heights NeighborhoodEstimated Value: $397,000 - $433,000
2
Beds
2
Baths
1,008
Sq Ft
$416/Sq Ft
Est. Value
About This Home
This home is located at 16 Menlo Ave, Brockton, MA 02301 and is currently estimated at $419,254, approximately $415 per square foot. 16 Menlo Ave is a home located in Plymouth County with nearby schools including Gilmore Elementary School, John F. Kennedy Elementary School, and Davis K-8 School.
Ownership History
Date
Name
Owned For
Owner Type
Purchase Details
Closed on
Nov 2, 2023
Sold by
Mcewan Marion S
Bought by
M S Mcewan Ft and Mcewan
Current Estimated Value
Purchase Details
Closed on
Jul 2, 2001
Sold by
Santry Marion B
Bought by
Mcewan Marion S
Home Financials for this Owner
Home Financials are based on the most recent Mortgage that was taken out on this home.
Original Mortgage
$100,000
Interest Rate
7.14%
Mortgage Type
Purchase Money Mortgage
Create a Home Valuation Report for This Property
The Home Valuation Report is an in-depth analysis detailing your home's value as well as a comparison with similar homes in the area
Home Values in the Area
Average Home Value in this Area
Purchase History
| Date | Buyer | Sale Price | Title Company |
|---|---|---|---|
| M S Mcewan Ft | -- | None Available | |
| Mcewan Marion S | $140,000 | -- |
Source: Public Records
Mortgage History
| Date | Status | Borrower | Loan Amount |
|---|---|---|---|
| Previous Owner | Mcewan Marion S | $89,230 | |
| Previous Owner | Mcewan Marion S | $100,000 | |
| Previous Owner | Mcewan Marion S | $100,000 |
Source: Public Records
Tax History Compared to Growth
Tax History
| Year | Tax Paid | Tax Assessment Tax Assessment Total Assessment is a certain percentage of the fair market value that is determined by local assessors to be the total taxable value of land and additions on the property. | Land | Improvement |
|---|---|---|---|---|
| 2025 | $4,287 | $354,000 | $139,200 | $214,800 |
| 2024 | $4,191 | $348,700 | $139,200 | $209,500 |
| 2023 | $4,125 | $317,800 | $103,500 | $214,300 |
| 2022 | $3,976 | $284,600 | $94,000 | $190,600 |
| 2021 | $3,814 | $263,000 | $78,000 | $185,000 |
| 2020 | $3,812 | $251,600 | $73,200 | $178,400 |
| 2019 | $3,882 | $249,800 | $71,300 | $178,500 |
| 2018 | $3,583 | $223,100 | $71,300 | $151,800 |
| 2017 | $2,962 | $184,000 | $71,300 | $112,700 |
| 2016 | $3,022 | $174,100 | $69,100 | $105,000 |
| 2015 | $2,753 | $151,700 | $69,100 | $82,600 |
| 2014 | $2,908 | $160,400 | $69,100 | $91,300 |
Source: Public Records
Map
Nearby Homes