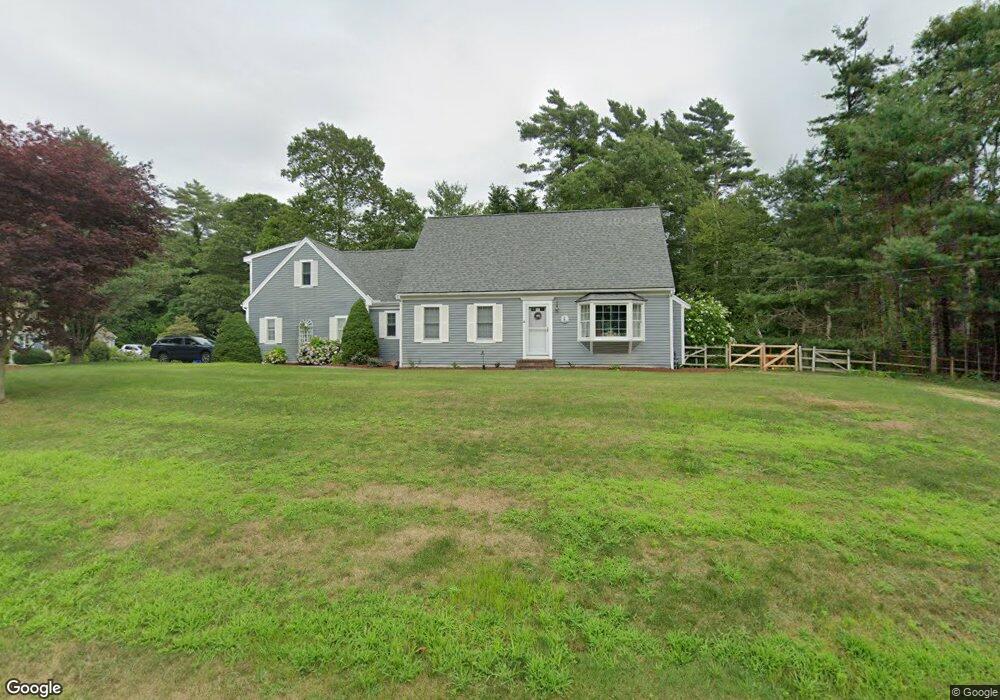
16 Midway Rd Pocasset, MA 02559
Monument Beach NeighborhoodEstimated Value: $845,000 - $924,000
4
Beds
3
Baths
2,423
Sq Ft
$369/Sq Ft
Est. Value
About This Home
This home is located at 16 Midway Rd, Pocasset, MA 02559 and is currently estimated at $893,574, approximately $368 per square foot. 16 Midway Rd is a home located in Barnstable County with nearby schools including Bourne High School.
Ownership History
Date
Name
Owned For
Owner Type
Purchase Details
Closed on
Jun 22, 2010
Sold by
Blount William F and Blount Christine A
Bought by
Popielnicki Ted J and Popielnicki Ana A
Current Estimated Value
Home Financials for this Owner
Home Financials are based on the most recent Mortgage that was taken out on this home.
Original Mortgage
$310,000
Outstanding Balance
$207,577
Interest Rate
5.03%
Mortgage Type
Purchase Money Mortgage
Estimated Equity
$685,997
Purchase Details
Closed on
Dec 11, 1998
Sold by
Iacoboni Cerillo T
Bought by
Blount William F and Blount Christine A
Purchase Details
Closed on
Feb 15, 1995
Sold by
Murphy Joseph F and Murphy Anne L
Bought by
Iacoboni Cerillo T R and Iacoboni Nancy E
Create a Home Valuation Report for This Property
The Home Valuation Report is an in-depth analysis detailing your home's value as well as a comparison with similar homes in the area
Home Values in the Area
Average Home Value in this Area
Purchase History
| Date | Buyer | Sale Price | Title Company |
|---|---|---|---|
| Popielnicki Ted J | $430,000 | -- | |
| Popielnicki Ted J | $430,000 | -- | |
| Blount William F | $60,000 | -- | |
| Blount William F | $60,000 | -- | |
| Iacoboni Cerillo T R | $47,500 | -- | |
| Iacoboni Cerillo T R | $47,500 | -- |
Source: Public Records
Mortgage History
| Date | Status | Borrower | Loan Amount |
|---|---|---|---|
| Open | Popielnicki Ted J | $310,000 | |
| Closed | Iacoboni Cerillo T R | $310,000 | |
| Previous Owner | Iacoboni Cerillo T R | $30,000 |
Source: Public Records
Tax History Compared to Growth
Tax History
| Year | Tax Paid | Tax Assessment Tax Assessment Total Assessment is a certain percentage of the fair market value that is determined by local assessors to be the total taxable value of land and additions on the property. | Land | Improvement |
|---|---|---|---|---|
| 2025 | $5,942 | $760,800 | $197,600 | $563,200 |
| 2024 | $5,397 | $672,900 | $188,100 | $484,800 |
| 2023 | $5,246 | $595,500 | $166,500 | $429,000 |
| 2022 | $4,962 | $491,800 | $147,300 | $344,500 |
| 2021 | $4,716 | $437,900 | $134,100 | $303,800 |
| 2020 | $4,458 | $415,100 | $132,800 | $282,300 |
| 2019 | $4,196 | $399,200 | $132,800 | $266,400 |
| 2018 | $4,039 | $383,200 | $126,500 | $256,700 |
| 2017 | $3,905 | $379,100 | $119,100 | $260,000 |
| 2016 | $3,785 | $372,500 | $119,100 | $253,400 |
| 2015 | $3,624 | $359,900 | $106,500 | $253,400 |
Source: Public Records
Map
Nearby Homes
- 501 County Rd
- 515 County Rd
- 566 Shore Rd
- 18 Douglas Ave
- 30 Howard Ave
- 39 Bennets Neck Dr
- 93 Valley Bars Rd
- 105 Clay Pond Rd
- 18 Carlton Rd
- 14 Navajo Rd
- 709 County Rd
- 174 Barlows Landing Rd
- 254 Barlows Landing Rd
- 940 County Rd
- 12 Beachwood Rd
- 15 1st St
- 2 Westerly Dr
- 7 Portside Dr
- 7 4th Ave
- 41 Portside Dr