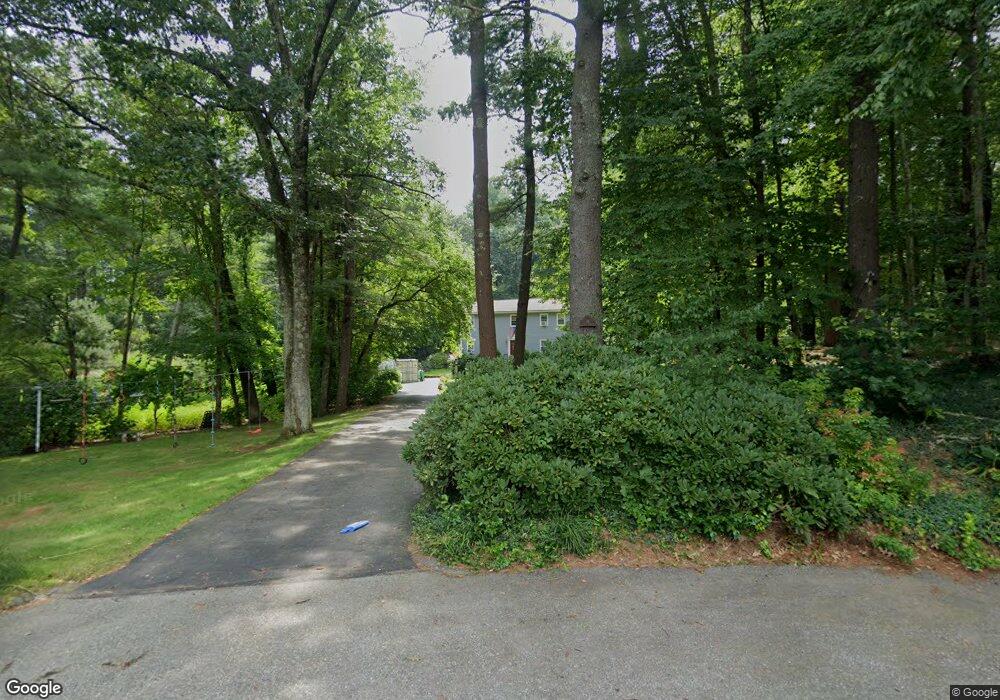
16 Morse Cir Northborough, MA 01532
Estimated Value: $802,000 - $905,000
4
Beds
3
Baths
2,454
Sq Ft
$344/Sq Ft
Est. Value
About This Home
This home is located at 16 Morse Cir, Northborough, MA 01532 and is currently estimated at $843,092, approximately $343 per square foot. 16 Morse Cir is a home located in Worcester County with nearby schools including Marion E. Zeh Elementary School, Robert E. Melican Middle School, and Algonquin Regional High School.
Ownership History
Date
Name
Owned For
Owner Type
Purchase Details
Closed on
Dec 22, 2021
Sold by
Walter William J and Walter Ann M
Bought by
Ann M Walter T
Current Estimated Value
Purchase Details
Closed on
Oct 29, 1987
Sold by
Harper Peter P
Bought by
Gleason Robert D
Home Financials for this Owner
Home Financials are based on the most recent Mortgage that was taken out on this home.
Original Mortgage
$100,000
Interest Rate
10.97%
Mortgage Type
Purchase Money Mortgage
Create a Home Valuation Report for This Property
The Home Valuation Report is an in-depth analysis detailing your home's value as well as a comparison with similar homes in the area
Home Values in the Area
Average Home Value in this Area
Purchase History
| Date | Buyer | Sale Price | Title Company |
|---|---|---|---|
| Ann M Walter T | -- | None Available | |
| Gleason Robert D | $182,800 | -- |
Source: Public Records
Mortgage History
| Date | Status | Borrower | Loan Amount |
|---|---|---|---|
| Previous Owner | Gleason Robert D | $211,600 | |
| Previous Owner | Gleason Robert D | $50,000 | |
| Previous Owner | Gleason Robert D | $100,000 |
Source: Public Records
Tax History Compared to Growth
Tax History
| Year | Tax Paid | Tax Assessment Tax Assessment Total Assessment is a certain percentage of the fair market value that is determined by local assessors to be the total taxable value of land and additions on the property. | Land | Improvement |
|---|---|---|---|---|
| 2025 | $10,508 | $737,400 | $330,000 | $407,400 |
| 2024 | $9,252 | $647,900 | $261,400 | $386,500 |
| 2023 | $8,827 | $596,800 | $247,000 | $349,800 |
| 2022 | $8,555 | $518,800 | $235,800 | $283,000 |
| 2021 | $8,242 | $481,400 | $215,400 | $266,000 |
| 2020 | $8,204 | $475,600 | $203,800 | $271,800 |
| 2019 | $7,963 | $464,300 | $198,200 | $266,100 |
| 2018 | $7,031 | $404,300 | $191,800 | $212,500 |
| 2017 | $6,881 | $395,700 | $191,800 | $203,900 |
| 2016 | $6,732 | $392,100 | $188,200 | $203,900 |
| 2015 | $6,936 | $414,600 | $199,200 | $215,400 |
| 2014 | $6,716 | $404,800 | $199,200 | $205,600 |
Source: Public Records
Map
Nearby Homes