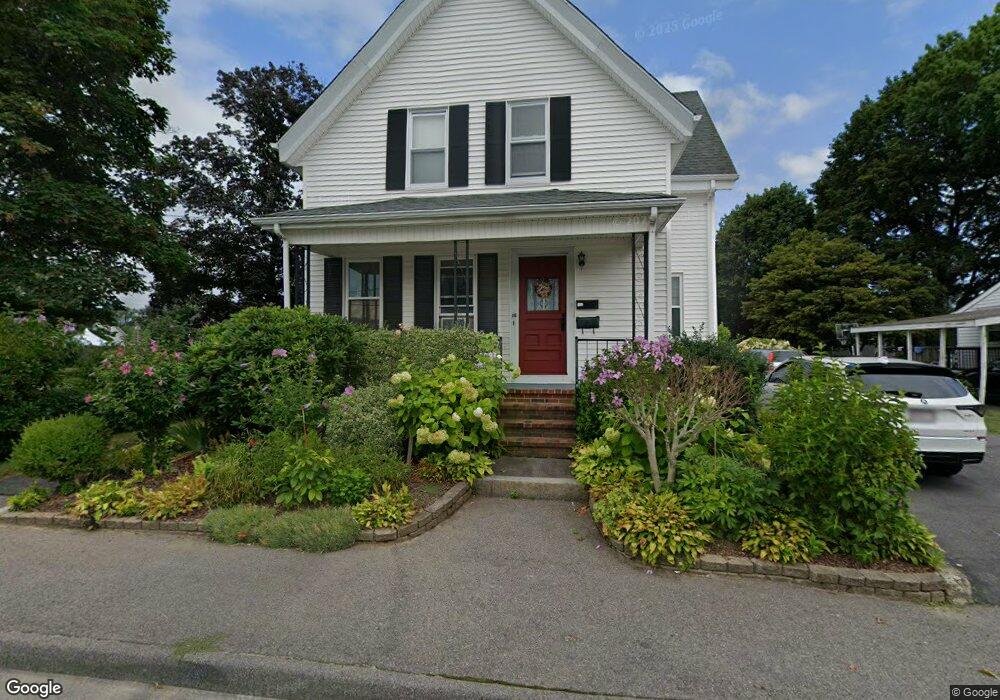
16 Morton St Taunton, MA 02780
Whittenton NeighborhoodEstimated Value: $461,000 - $640,000
4
Beds
2
Baths
1,904
Sq Ft
$290/Sq Ft
Est. Value
About This Home
This home is located at 16 Morton St, Taunton, MA 02780 and is currently estimated at $552,325, approximately $290 per square foot. 16 Morton St is a home located in Bristol County with nearby schools including H. H. Galligan School, Taunton High School, and John F. Parker Middle School.
Ownership History
Date
Name
Owned For
Owner Type
Purchase Details
Closed on
Jul 19, 2024
Sold by
Diniz Antero M and Diniz Doris M
Bought by
Diniz Ft and Diniz
Current Estimated Value
Purchase Details
Closed on
Jan 26, 2018
Sold by
Dias Virgilio C and Dias Rosa C
Bought by
Dias Irt and Dias
Purchase Details
Closed on
Jan 1, 1978
Bought by
Dias Virgilio C and Dias Rosa C
Create a Home Valuation Report for This Property
The Home Valuation Report is an in-depth analysis detailing your home's value as well as a comparison with similar homes in the area
Home Values in the Area
Average Home Value in this Area
Purchase History
| Date | Buyer | Sale Price | Title Company |
|---|---|---|---|
| Diniz Ft | -- | None Available | |
| Diniz Ft | -- | None Available | |
| Dias Irt | -- | -- | |
| Dias Irt | -- | -- | |
| Dias Virgilio C | -- | -- |
Source: Public Records
Tax History Compared to Growth
Tax History
| Year | Tax Paid | Tax Assessment Tax Assessment Total Assessment is a certain percentage of the fair market value that is determined by local assessors to be the total taxable value of land and additions on the property. | Land | Improvement |
|---|---|---|---|---|
| 2025 | $5,110 | $467,100 | $105,300 | $361,800 |
| 2024 | $4,433 | $396,200 | $105,300 | $290,900 |
| 2023 | $4,154 | $344,700 | $105,300 | $239,400 |
| 2022 | $3,738 | $283,600 | $87,800 | $195,800 |
| 2021 | $3,627 | $255,400 | $79,800 | $175,600 |
| 2020 | $3,540 | $238,200 | $79,800 | $158,400 |
| 2019 | $3,239 | $205,500 | $79,800 | $125,700 |
| 2018 | $3,120 | $198,500 | $80,600 | $117,900 |
| 2017 | $2,881 | $183,400 | $76,400 | $107,000 |
| 2016 | $2,768 | $176,500 | $74,200 | $102,300 |
| 2015 | $2,498 | $166,400 | $73,300 | $93,100 |
| 2014 | $2,431 | $166,400 | $73,300 | $93,100 |
Source: Public Records
Map
Nearby Homes
- 13 Stanley Ave
- 54 Adams St
- 16 Kilton St
- 48 Oak St
- 99 Tremont St
- 6 Clark Ave
- 51 Shores St
- 0 Eldridge St Unit 73454842
- 108 Tremont St
- 5 Dean Ave
- 9 Bradford St
- 19 Mason St
- 26 Kilmer Ave
- 48 Taunton Green
- 39 Myrtle St
- 71 Eldridge St
- 96 Danforth St Unit 49
- 46 Harrison St Unit 4
- 137 Tremont St
- 63 Kilmer Ave