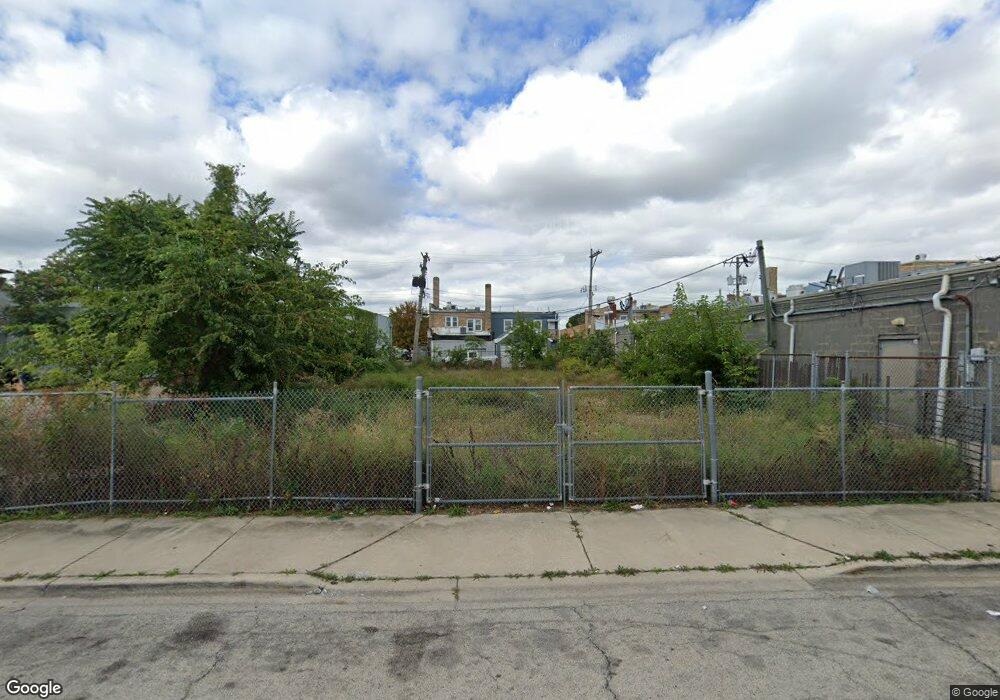
16 N 4th Ave Maywood, IL 60153
Downtown Maywood Neighborhood
--
Bed
--
Bath
2,288
Sq Ft
6,621
Sq Ft Lot
About This Home
This home is located at 16 N 4th Ave, Maywood, IL 60153. 16 N 4th Ave is a home located in Cook County with nearby schools including Lincoln Elementary School, Stevenson Middle School, and Proviso East High School.
Ownership History
Date
Name
Owned For
Owner Type
Purchase Details
Closed on
May 20, 2003
Sold by
Yanez Freddy and Yanez Sharon
Bought by
320 W Lake Street Llc
Home Financials for this Owner
Home Financials are based on the most recent Mortgage that was taken out on this home.
Original Mortgage
$297,500
Outstanding Balance
$130,146
Interest Rate
5.88%
Mortgage Type
Commercial
Purchase Details
Closed on
Nov 2, 1998
Sold by
Tarsitano William
Bought by
Yanez Freddy and Yanez Sharon
Purchase Details
Closed on
Aug 19, 1998
Sold by
Advanced Investments Inc
Bought by
Tarsitano William
Create a Home Valuation Report for This Property
The Home Valuation Report is an in-depth analysis detailing your home's value as well as a comparison with similar homes in the area
Home Values in the Area
Average Home Value in this Area
Purchase History
| Date | Buyer | Sale Price | Title Company |
|---|---|---|---|
| 320 W Lake Street Llc | $325,000 | Chicago Title Insurance Co | |
| 320 W Lake Street Llc | $325,000 | Chicago Title Insurance Co | |
| Yanez Freddy | $16,000 | -- | |
| Tarsitano William | $16,000 | -- |
Source: Public Records
Mortgage History
| Date | Status | Borrower | Loan Amount |
|---|---|---|---|
| Open | 320 W Lake Street Llc | $297,500 | |
| Closed | 320 W Lake Street Llc | $297,500 |
Source: Public Records
Tax History Compared to Growth
Tax History
| Year | Tax Paid | Tax Assessment Tax Assessment Total Assessment is a certain percentage of the fair market value that is determined by local assessors to be the total taxable value of land and additions on the property. | Land | Improvement |
|---|---|---|---|---|
| 2024 | $10,769 | $24,995 | $23,142 | $1,853 |
| 2023 | $8,488 | $24,995 | $23,142 | $1,853 |
| 2022 | $8,488 | $15,077 | $13,224 | $1,853 |
| 2021 | $8,522 | $15,076 | $13,224 | $1,852 |
| 2020 | $8,309 | $15,076 | $13,224 | $1,852 |
| 2019 | $7,436 | $11,770 | $9,918 | $1,852 |
| 2018 | $7,235 | $11,770 | $9,918 | $1,852 |
| 2017 | $6,991 | $11,770 | $9,918 | $1,852 |
| 2016 | $6,436 | $10,364 | $9,091 | $1,273 |
| 2015 | $5,999 | $10,364 | $9,091 | $1,273 |
| 2014 | $5,487 | $10,364 | $9,091 | $1,273 |
| 2013 | $5,293 | $10,943 | $9,091 | $1,852 |
Source: Public Records
Map
Nearby Homes