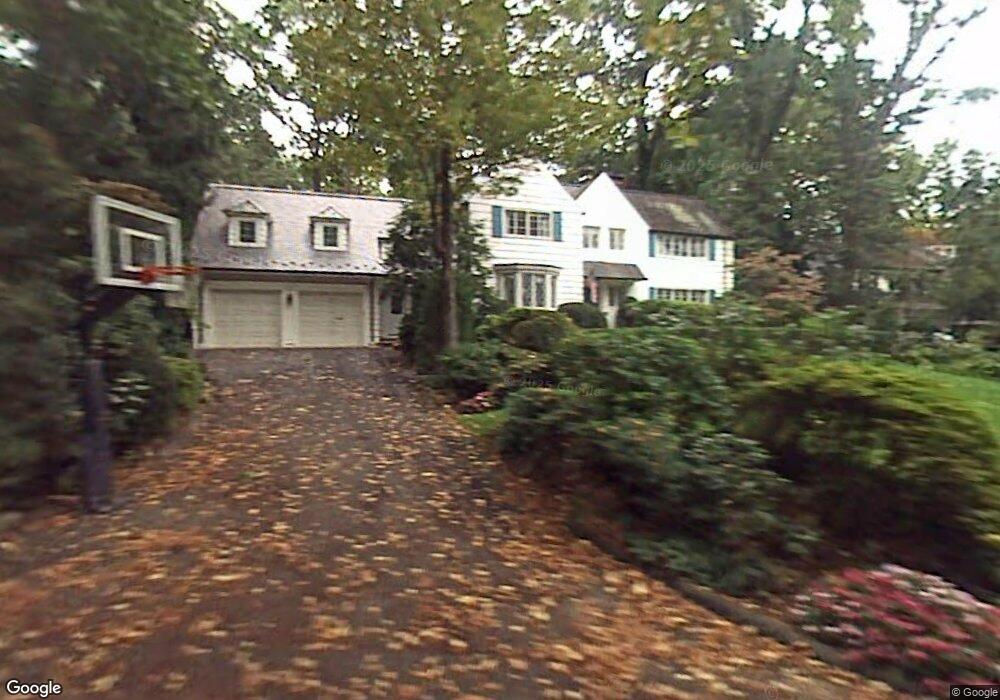
16 N Brae Ct Tenafly, NJ 07670
Estimated Value: $2,268,018 - $2,868,000
--
Bed
--
Bath
4,109
Sq Ft
$625/Sq Ft
Est. Value
About This Home
This home is located at 16 N Brae Ct, Tenafly, NJ 07670 and is currently estimated at $2,568,505, approximately $625 per square foot. 16 N Brae Ct is a home located in Bergen County with nearby schools including Tenafly Middle School, Tenafly High School, and Spring School.
Ownership History
Date
Name
Owned For
Owner Type
Purchase Details
Closed on
Jul 12, 2013
Sold by
Cicco Barbara
Bought by
Hecht Joseph M and Hecht Lisa B
Current Estimated Value
Home Financials for this Owner
Home Financials are based on the most recent Mortgage that was taken out on this home.
Original Mortgage
$1,068,700
Outstanding Balance
$787,833
Interest Rate
4.25%
Mortgage Type
Stand Alone Refi Refinance Of Original Loan
Estimated Equity
$1,780,672
Create a Home Valuation Report for This Property
The Home Valuation Report is an in-depth analysis detailing your home's value as well as a comparison with similar homes in the area
Home Values in the Area
Average Home Value in this Area
Purchase History
| Date | Buyer | Sale Price | Title Company |
|---|---|---|---|
| Hecht Joseph M | $1,425,000 | -- |
Source: Public Records
Mortgage History
| Date | Status | Borrower | Loan Amount |
|---|---|---|---|
| Open | Hecht Joseph M | $1,068,700 |
Source: Public Records
Tax History Compared to Growth
Tax History
| Year | Tax Paid | Tax Assessment Tax Assessment Total Assessment is a certain percentage of the fair market value that is determined by local assessors to be the total taxable value of land and additions on the property. | Land | Improvement |
|---|---|---|---|---|
| 2025 | $36,581 | $1,287,600 | $766,800 | $520,800 |
| 2024 | $35,692 | $1,287,600 | $766,800 | $520,800 |
| 2023 | $34,830 | $1,287,600 | $766,800 | $520,800 |
| 2022 | $34,830 | $1,287,600 | $766,800 | $520,800 |
| 2021 | $34,212 | $1,287,600 | $766,800 | $520,800 |
| 2020 | $33,709 | $1,287,600 | $766,800 | $520,800 |
| 2019 | $33,117 | $1,287,600 | $766,800 | $520,800 |
| 2018 | $32,602 | $1,287,600 | $766,800 | $520,800 |
| 2017 | $32,486 | $1,287,600 | $766,800 | $520,800 |
| 2016 | $31,842 | $1,287,600 | $766,800 | $520,800 |
| 2015 | $31,134 | $1,287,600 | $766,800 | $520,800 |
| 2014 | $30,555 | $1,287,600 | $766,800 | $520,800 |
Source: Public Records
Map
Nearby Homes