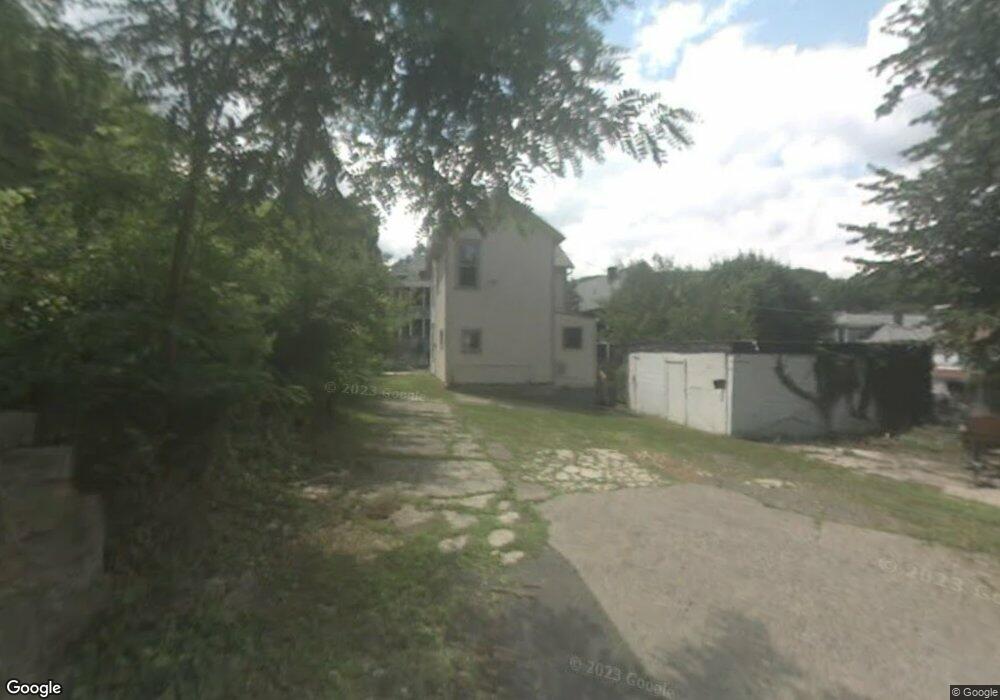
16 N Paw Paw Way Cumberland, MD 21502
Estimated Value: $102,000 - $162,000
3
Beds
2
Baths
1,600
Sq Ft
$80/Sq Ft
Est. Value
About This Home
This home is located at 16 N Paw Paw Way, Cumberland, MD 21502 and is currently estimated at $128,658, approximately $80 per square foot. 16 N Paw Paw Way is a home located in Allegany County with nearby schools including West Side Elementary School, Braddock Middle School, and Allegany High School.
Ownership History
Date
Name
Owned For
Owner Type
Purchase Details
Closed on
Jul 9, 2019
Sold by
Secretary Of Housing & Urban Development
Bought by
Zimela Thomas A
Current Estimated Value
Purchase Details
Closed on
Feb 28, 2019
Sold by
First Guaranty Mortgage Corporation
Bought by
Secretary Of Housing & Urban Development
Purchase Details
Closed on
Oct 18, 2018
Sold by
Sm Ith Emily N
Bought by
First Guaranty Mortgage Corp
Purchase Details
Closed on
Jan 8, 2014
Sold by
Mckay Michael
Bought by
Smith Emily N
Home Financials for this Owner
Home Financials are based on the most recent Mortgage that was taken out on this home.
Original Mortgage
$4,220
Interest Rate
4.4%
Mortgage Type
New Conventional
Purchase Details
Closed on
May 31, 2005
Sold by
Prendergast John E and Prendergast Mary J
Bought by
Prendergast Hope Marie
Create a Home Valuation Report for This Property
The Home Valuation Report is an in-depth analysis detailing your home's value as well as a comparison with similar homes in the area
Home Values in the Area
Average Home Value in this Area
Purchase History
| Date | Buyer | Sale Price | Title Company |
|---|---|---|---|
| Zimela Thomas A | $21,600 | Commonwealth Land Ttl Ins Co | |
| Secretary Of Housing & Urban Development | -- | Servicelink | |
| First Guaranty Mortgage Corp | $22,800 | None Available | |
| Smith Emily N | $62,000 | None Available | |
| Prendergast Hope Marie | -- | -- |
Source: Public Records
Mortgage History
| Date | Status | Borrower | Loan Amount |
|---|---|---|---|
| Previous Owner | Smith Emily N | $4,220 | |
| Previous Owner | Smith Emily N | $60,381 |
Source: Public Records
Tax History Compared to Growth
Tax History
| Year | Tax Paid | Tax Assessment Tax Assessment Total Assessment is a certain percentage of the fair market value that is determined by local assessors to be the total taxable value of land and additions on the property. | Land | Improvement |
|---|---|---|---|---|
| 2025 | $570 | $66,167 | $0 | $0 |
| 2024 | $570 | $60,833 | $0 | $0 |
| 2023 | $516 | $55,500 | $6,000 | $49,500 |
| 2022 | $515 | $55,500 | $6,000 | $49,500 |
| 2021 | $519 | $55,500 | $6,000 | $49,500 |
| 2020 | $517 | $55,700 | $6,000 | $49,700 |
| 2019 | $510 | $54,567 | $0 | $0 |
| 2018 | $503 | $53,433 | $0 | $0 |
| 2017 | $428 | $52,300 | $0 | $0 |
| 2016 | $216 | $45,067 | $0 | $0 |
| 2015 | $295 | $37,833 | $0 | $0 |
| 2014 | $295 | $30,600 | $0 | $0 |
Source: Public Records
Map
Nearby Homes
- 11 N Allegany St
- 13 N Allegany St
- 417 Fayette St
- 312 Washington St
- 520 Cumberland St
- 113 N Chase St
- 303 Washington St
- 20 N Lee St
- 531 Cumberland St
- 212 Schley St
- 216 & 218 Saratoga St
- 9 N Lee St
- 223 225 Washington St
- 628 Fayette St
- 511 Patterson Ave
- 615 Greene St
- 415 Beall St
- 503 Avirett Ave
- 123 Cumberland St
- 101 Greene St
- 16 N Paw Way
- 420 Fayette St
- 418 Fayette St
- 424 Fayette St
- 422 Fayette St
- 15 N Allegany St
- 416 Fayette St
- 417 Washington St
- 17 N Allegany St
- 426 Fayette St
- 415 Washington St
- 414 Fayette St
- 411 Washington St
- 21 N Allegany St
- 407 Washington St
- 410 Fayette St
- 412 Fayette St
- 17 N Paw Paw Way
- 408 Fayette St
- 406 Fayette St