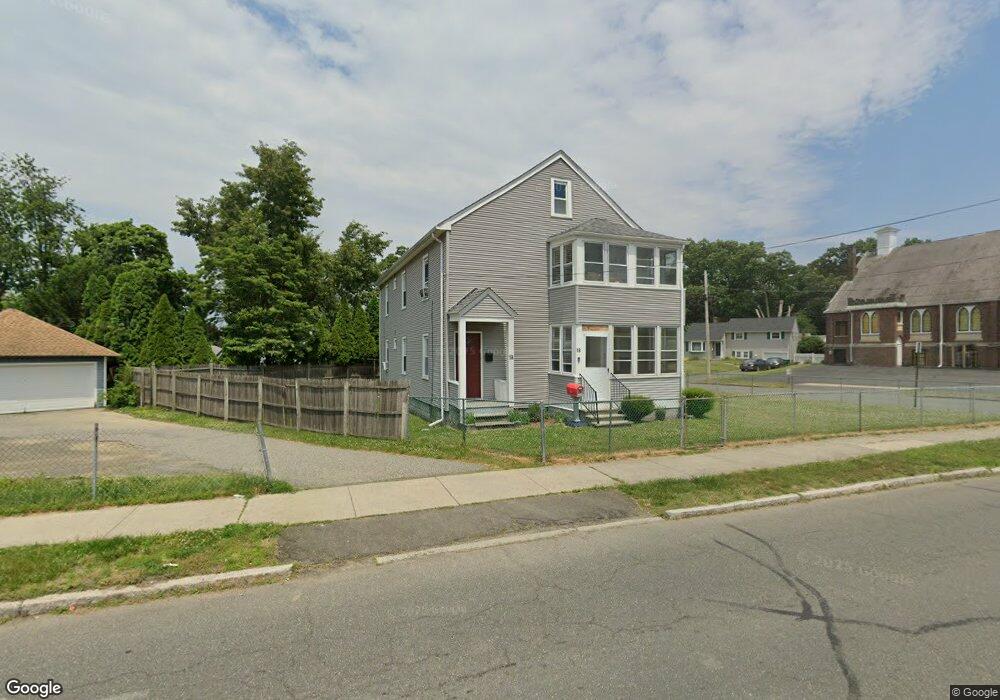
16 Newbury St Chicopee, MA 01013
Chicopee Center NeighborhoodEstimated Value: $329,000 - $380,000
6
Beds
2
Baths
2,288
Sq Ft
$152/Sq Ft
Est. Value
About This Home
This home is located at 16 Newbury St, Chicopee, MA 01013 and is currently estimated at $348,512, approximately $152 per square foot. 16 Newbury St is a home located in Hampden County with nearby schools including Bowe Elementary School, Fairview Middle School, and Chicopee High School.
Ownership History
Date
Name
Owned For
Owner Type
Purchase Details
Closed on
May 2, 2024
Sold by
Marques John and Marques Maria I
Bought by
Marques John and Marques Maria I
Current Estimated Value
Purchase Details
Closed on
Mar 20, 1981
Bought by
Marques John and Marques Maria I
Create a Home Valuation Report for This Property
The Home Valuation Report is an in-depth analysis detailing your home's value as well as a comparison with similar homes in the area
Home Values in the Area
Average Home Value in this Area
Purchase History
| Date | Buyer | Sale Price | Title Company |
|---|---|---|---|
| Marques John | -- | None Available | |
| Marques John | -- | None Available | |
| Marques John | -- | -- |
Source: Public Records
Mortgage History
| Date | Status | Borrower | Loan Amount |
|---|---|---|---|
| Previous Owner | Marques John | $60,000 |
Source: Public Records
Tax History Compared to Growth
Tax History
| Year | Tax Paid | Tax Assessment Tax Assessment Total Assessment is a certain percentage of the fair market value that is determined by local assessors to be the total taxable value of land and additions on the property. | Land | Improvement |
|---|---|---|---|---|
| 2025 | $4,322 | $285,100 | $83,400 | $201,700 |
| 2024 | $4,087 | $276,900 | $81,800 | $195,100 |
| 2023 | $3,812 | $251,600 | $74,400 | $177,200 |
| 2022 | $3,723 | $219,100 | $64,700 | $154,400 |
| 2021 | $3,526 | $200,200 | $58,800 | $141,400 |
| 2020 | $3,324 | $190,400 | $58,800 | $131,600 |
| 2019 | $3,244 | $180,600 | $58,800 | $121,800 |
| 2018 | $3,803 | $172,900 | $56,000 | $116,900 |
| 2017 | $2,962 | $171,100 | $56,000 | $115,100 |
| 2016 | $2,689 | $159,000 | $56,000 | $103,000 |
| 2015 | $2,868 | $163,500 | $56,000 | $107,500 |
| 2014 | $2,699 | $163,500 | $56,000 | $107,500 |
Source: Public Records
Map
Nearby Homes
- 16 Greenleaf St
- 435 Springfield St
- 437 Springfield St
- 435 Springfield St Unit 1
- 435 Springfield St Unit 2
- 24 Greenleaf St
- 433 Springfield St
- 431 Springfield St
- 11 Greenleaf St
- 425 Springfield St
- 30 Greenleaf St
- 17 Greenleaf St
- 23 Greenleaf St
- 421 Springfield St
- 463 Springfield St
- 423 Springfield St
- 36 Greenleaf St
- 469 Springfield St
- 29 Greenleaf St
- 417 Springfield St