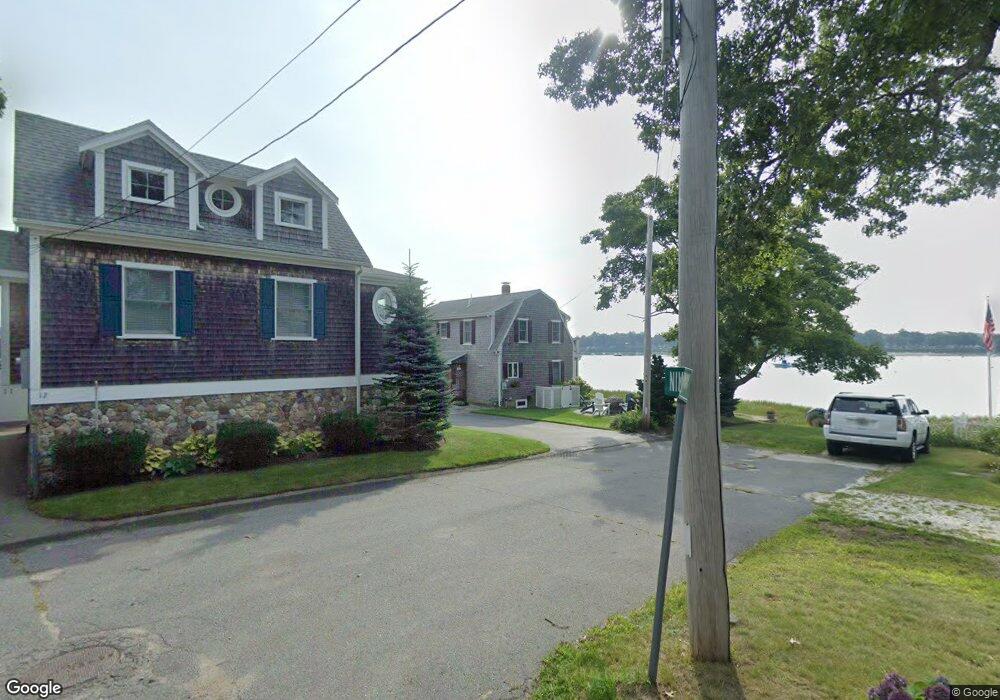
16 Nimrod Way Wareham, MA 02571
Wareham Center NeighborhoodEstimated Value: $807,000 - $948,000
3
Beds
2
Baths
1,408
Sq Ft
$631/Sq Ft
Est. Value
About This Home
This home is located at 16 Nimrod Way, Wareham, MA 02571 and is currently estimated at $888,497, approximately $631 per square foot. 16 Nimrod Way is a home located in Plymouth County.
Ownership History
Date
Name
Owned For
Owner Type
Purchase Details
Closed on
Jan 24, 2018
Sold by
Quattrociocchi Paul D and Quattrociocchi Adriana
Bought by
Quarttrociacchi
Current Estimated Value
Purchase Details
Closed on
Oct 17, 2008
Sold by
Zaccaria Adrain and Zaccaria Mary S
Bought by
Quattrociocchi Paul D and Quattrociocchi Adriana
Purchase Details
Closed on
Jul 29, 2002
Sold by
Fruci John J
Bought by
Zaccaria Mary S and Zaccaria Adrian
Create a Home Valuation Report for This Property
The Home Valuation Report is an in-depth analysis detailing your home's value as well as a comparison with similar homes in the area
Home Values in the Area
Average Home Value in this Area
Purchase History
| Date | Buyer | Sale Price | Title Company |
|---|---|---|---|
| Quarttrociacchi | -- | -- | |
| Quarttrociacchi | -- | -- | |
| Quattrociocchi Paul D | $585,000 | -- | |
| Quattrociocchi Paul D | $585,000 | -- | |
| Zaccaria Mary S | $480,000 | -- | |
| Zaccaria Mary S | $480,000 | -- |
Source: Public Records
Mortgage History
| Date | Status | Borrower | Loan Amount |
|---|---|---|---|
| Previous Owner | Zaccaria Mary S | $17,000 |
Source: Public Records
Tax History Compared to Growth
Tax History
| Year | Tax Paid | Tax Assessment Tax Assessment Total Assessment is a certain percentage of the fair market value that is determined by local assessors to be the total taxable value of land and additions on the property. | Land | Improvement |
|---|---|---|---|---|
| 2025 | $8,042 | $771,800 | $408,500 | $363,300 |
| 2024 | $7,401 | $659,000 | $314,700 | $344,300 |
| 2023 | $6,996 | $590,100 | $286,000 | $304,100 |
| 2022 | $6,996 | $530,800 | $286,000 | $244,800 |
| 2021 | $6,974 | $518,500 | $286,000 | $232,500 |
| 2020 | $6,658 | $502,100 | $286,000 | $216,100 |
| 2019 | $6,125 | $460,900 | $256,100 | $204,800 |
| 2018 | $6,007 | $440,700 | $256,100 | $184,600 |
| 2017 | $5,765 | $428,600 | $256,100 | $172,500 |
| 2016 | $5,305 | $392,100 | $243,800 | $148,300 |
| 2015 | $5,125 | $392,100 | $243,800 | $148,300 |
| 2014 | $5,348 | $416,200 | $231,800 | $184,400 |
Source: Public Records
Map
Nearby Homes