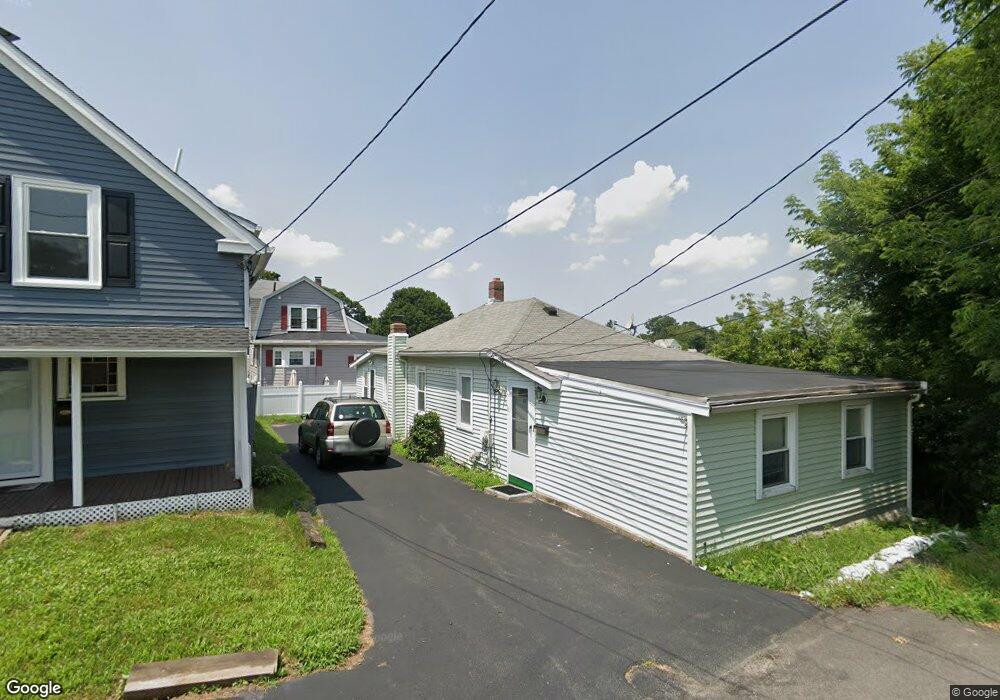
16 Noanet St Quincy, MA 02169
Adams Shore NeighborhoodEstimated Value: $531,000 - $537,000
3
Beds
1
Bath
1,160
Sq Ft
$460/Sq Ft
Est. Value
About This Home
This home is located at 16 Noanet St, Quincy, MA 02169 and is currently estimated at $533,378, approximately $459 per square foot. 16 Noanet St is a home located in Norfolk County with nearby schools including Merrymount Elementary School, Broad Meadows Middle School, and Quincy High School.
Ownership History
Date
Name
Owned For
Owner Type
Purchase Details
Closed on
Sep 12, 2003
Sold by
Boidi Catherine M and Boidi Brian D
Bought by
Browne Judith A and Browne Duane
Current Estimated Value
Home Financials for this Owner
Home Financials are based on the most recent Mortgage that was taken out on this home.
Original Mortgage
$217,900
Interest Rate
6.22%
Mortgage Type
Purchase Money Mortgage
Purchase Details
Closed on
Sep 19, 2002
Sold by
Anthony Marie D
Bought by
Boide Brian D and Boide Catherine M
Create a Home Valuation Report for This Property
The Home Valuation Report is an in-depth analysis detailing your home's value as well as a comparison with similar homes in the area
Home Values in the Area
Average Home Value in this Area
Purchase History
| Date | Buyer | Sale Price | Title Company |
|---|---|---|---|
| Browne Judith A | $284,900 | -- | |
| Boide Brian D | $145,000 | -- | |
| Anthony Marie D | $105,010 | -- |
Source: Public Records
Mortgage History
| Date | Status | Borrower | Loan Amount |
|---|---|---|---|
| Open | Browne Judith A | $217,900 |
Source: Public Records
Tax History Compared to Growth
Tax History
| Year | Tax Paid | Tax Assessment Tax Assessment Total Assessment is a certain percentage of the fair market value that is determined by local assessors to be the total taxable value of land and additions on the property. | Land | Improvement |
|---|---|---|---|---|
| 2025 | $5,193 | $450,400 | $263,200 | $187,200 |
| 2024 | $4,917 | $436,300 | $255,500 | $180,800 |
| 2023 | $4,505 | $404,800 | $222,200 | $182,600 |
| 2022 | $4,490 | $374,800 | $202,000 | $172,800 |
| 2021 | $4,426 | $364,600 | $202,000 | $162,600 |
| 2020 | $4,219 | $339,400 | $194,200 | $145,200 |
| 2019 | $3,975 | $316,700 | $181,500 | $135,200 |
| 2018 | $3,777 | $283,100 | $157,900 | $125,200 |
| 2017 | $3,799 | $268,100 | $157,900 | $110,200 |
| 2016 | $3,768 | $262,400 | $157,900 | $104,500 |
| 2015 | $3,539 | $242,400 | $148,900 | $93,500 |
| 2014 | $3,381 | $227,500 | $141,800 | $85,700 |
Source: Public Records
Map
Nearby Homes