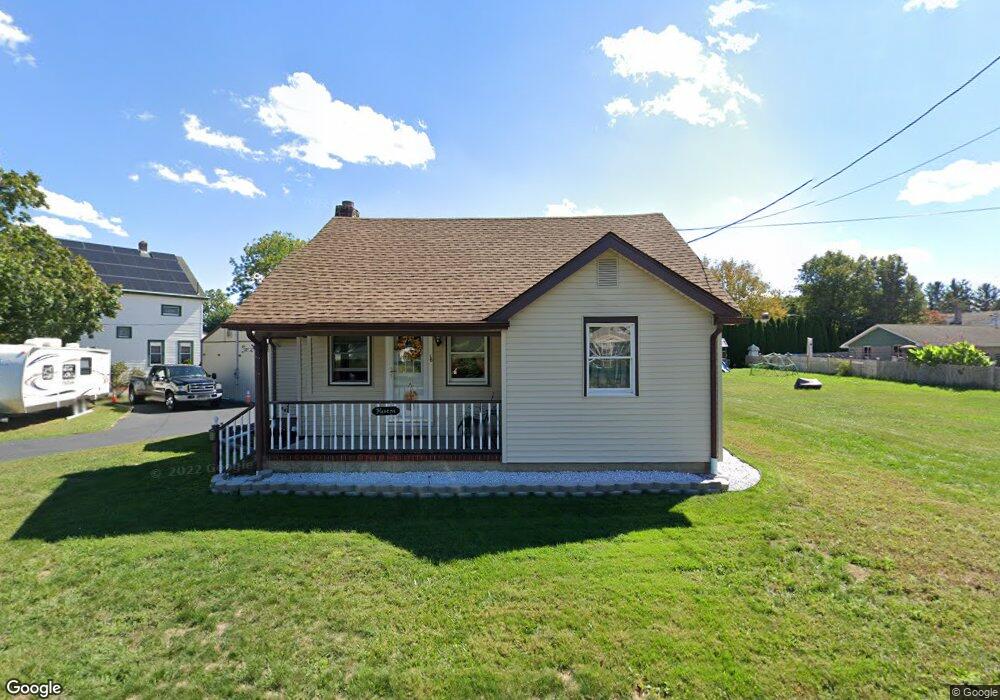
16 Oakford Ave New Egypt, NJ 08533
Estimated Value: $240,206 - $327,000
2
Beds
1
Bath
1,918
Sq Ft
$151/Sq Ft
Est. Value
About This Home
This home is located at 16 Oakford Ave, New Egypt, NJ 08533 and is currently estimated at $289,802, approximately $151 per square foot. 16 Oakford Ave is a home located in Ocean County with nearby schools including Dr. Gerald H. Woehr Elementary School, New Egypt Middle School, and New Egypt High School.
Ownership History
Date
Name
Owned For
Owner Type
Purchase Details
Closed on
Nov 2, 2016
Sold by
Hendrickson Treva M and Ruddiman John A
Bought by
Havens and Havens Regina
Current Estimated Value
Home Financials for this Owner
Home Financials are based on the most recent Mortgage that was taken out on this home.
Interest Rate
3.47%
Purchase Details
Closed on
Apr 21, 1992
Bought by
Havens Roger D and Butler Regina M
Create a Home Valuation Report for This Property
The Home Valuation Report is an in-depth analysis detailing your home's value as well as a comparison with similar homes in the area
Home Values in the Area
Average Home Value in this Area
Purchase History
| Date | Buyer | Sale Price | Title Company |
|---|---|---|---|
| Havens | -- | -- | |
| Havens Roger D | -- | -- |
Source: Public Records
Mortgage History
| Date | Status | Borrower | Loan Amount |
|---|---|---|---|
| Closed | Havens | -- |
Source: Public Records
Tax History Compared to Growth
Tax History
| Year | Tax Paid | Tax Assessment Tax Assessment Total Assessment is a certain percentage of the fair market value that is determined by local assessors to be the total taxable value of land and additions on the property. | Land | Improvement |
|---|---|---|---|---|
| 2025 | $4,825 | $155,100 | $81,800 | $73,300 |
| 2024 | $4,503 | $155,100 | $81,800 | $73,300 |
| 2023 | $4,296 | $155,100 | $81,800 | $73,300 |
| 2022 | $4,296 | $155,100 | $81,800 | $73,300 |
| 2021 | $4,146 | $155,100 | $81,800 | $73,300 |
| 2020 | $4,050 | $155,100 | $81,800 | $73,300 |
| 2019 | $3,966 | $155,100 | $81,800 | $73,300 |
| 2018 | $4,036 | $155,100 | $81,800 | $73,300 |
| 2017 | $3,966 | $155,100 | $81,800 | $73,300 |
| 2016 | $3,909 | $155,100 | $81,800 | $73,300 |
| 2015 | $3,798 | $155,100 | $81,800 | $73,300 |
| 2014 | $3,710 | $155,100 | $81,800 | $73,300 |
Source: Public Records
Map
Nearby Homes