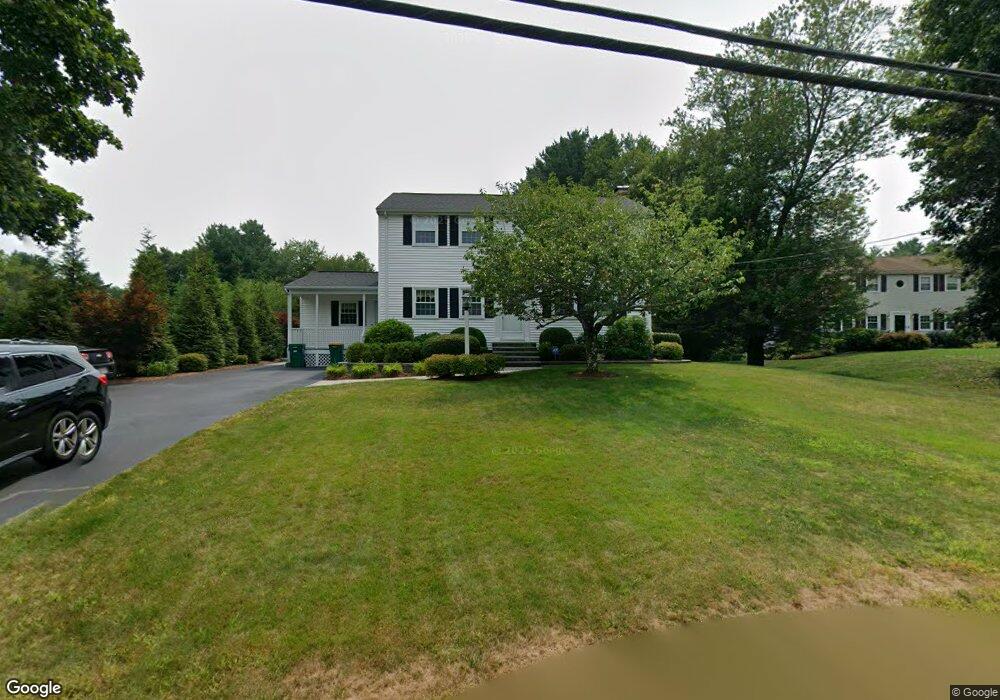
16 Old Elm St Mansfield, MA 02048
Estimated Value: $701,049 - $894,000
3
Beds
2
Baths
2,064
Sq Ft
$388/Sq Ft
Est. Value
About This Home
This home is located at 16 Old Elm St, Mansfield, MA 02048 and is currently estimated at $800,762, approximately $387 per square foot. 16 Old Elm St is a home located in Bristol County with nearby schools including Everett W. Robinson Elementary School, Jordan/Jackson Elementary School, and Harold L. Qualters Middle School.
Ownership History
Date
Name
Owned For
Owner Type
Purchase Details
Closed on
Nov 29, 1991
Sold by
Frazier Ronald E and Frazier Patrice
Bought by
Mcdonnell David and Mcdonnell Joyce
Current Estimated Value
Purchase Details
Closed on
Jul 10, 1987
Sold by
Coughlin Richard S
Bought by
Frazier Ronald E
Create a Home Valuation Report for This Property
The Home Valuation Report is an in-depth analysis detailing your home's value as well as a comparison with similar homes in the area
Home Values in the Area
Average Home Value in this Area
Purchase History
| Date | Buyer | Sale Price | Title Company |
|---|---|---|---|
| Mcdonnell David | $146,000 | -- | |
| Frazier Ronald E | $176,000 | -- |
Source: Public Records
Mortgage History
| Date | Status | Borrower | Loan Amount |
|---|---|---|---|
| Open | Frazier Ronald E | $218,746 | |
| Closed | Frazier Ronald E | $251,000 | |
| Closed | Frazier Ronald E | $136,700 |
Source: Public Records
Tax History Compared to Growth
Tax History
| Year | Tax Paid | Tax Assessment Tax Assessment Total Assessment is a certain percentage of the fair market value that is determined by local assessors to be the total taxable value of land and additions on the property. | Land | Improvement |
|---|---|---|---|---|
| 2025 | $7,890 | $599,100 | $244,100 | $355,000 |
| 2024 | $7,690 | $569,600 | $244,100 | $325,500 |
| 2023 | $7,444 | $528,300 | $244,100 | $284,200 |
| 2022 | $7,148 | $471,200 | $225,900 | $245,300 |
| 2021 | $7,107 | $462,700 | $197,800 | $264,900 |
| 2020 | $6,854 | $446,200 | $188,300 | $257,900 |
| 2019 | $6,348 | $417,100 | $156,900 | $260,200 |
| 2018 | $6,307 | $405,100 | $149,600 | $255,500 |
| 2017 | $5,915 | $393,800 | $145,400 | $248,400 |
| 2016 | $5,455 | $354,000 | $138,400 | $215,600 |
| 2015 | $5,315 | $342,900 | $138,400 | $204,500 |
Source: Public Records
Map
Nearby Homes
- 4 Buckskin Dr
- 176 Elm St
- 231 Spring St
- 150 Gilbert St
- 450 West St
- 2 Oak St Unit 2D
- 2 Oak St Unit 2A
- 2 Oak St Unit 2C
- 2 Oak St Unit 2B
- 24 Maverick Dr
- 37 Oakleaf Dr
- 451R Gilbert St
- 166 Chauncy St
- 255 Mckeon Dr
- 277 Central St
- 16 East St Unit 2
- 250 Mansfield Ave Unit 66
- 28 Court St
- 15 Reservoir St Unit 44
- 22 Pleasant St Unit C