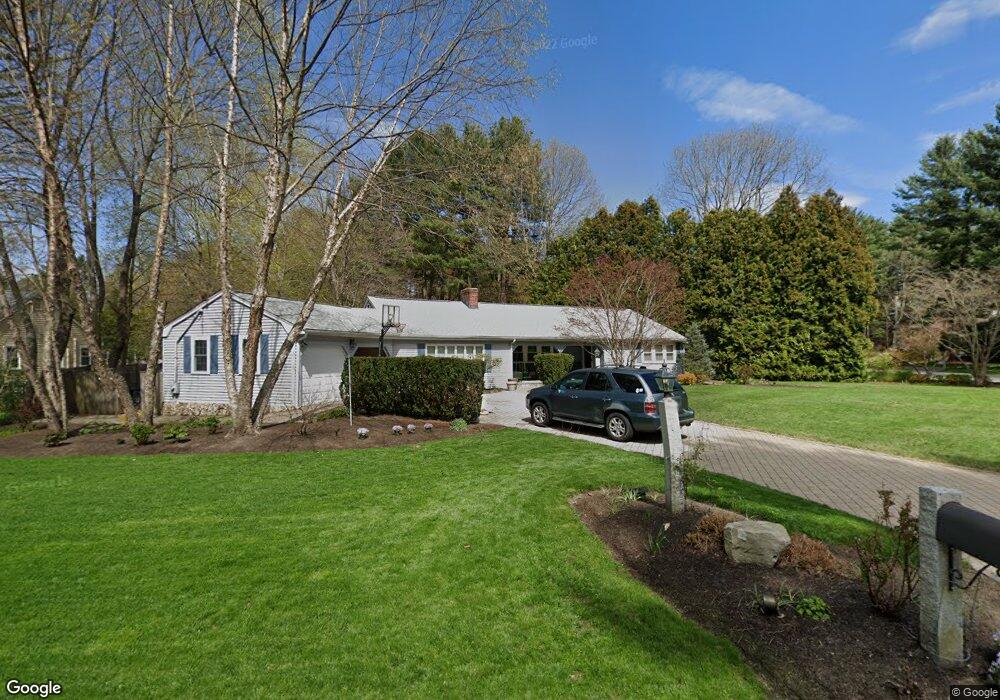
16 Old Farm Rd Wayland, MA 01778
Estimated Value: $964,309 - $1,172,000
3
Beds
2
Baths
1,828
Sq Ft
$581/Sq Ft
Est. Value
About This Home
This home is located at 16 Old Farm Rd, Wayland, MA 01778 and is currently estimated at $1,061,827, approximately $580 per square foot. 16 Old Farm Rd is a home located in Middlesex County with nearby schools including Wayland High School and Veritas Christian Academy.
Ownership History
Date
Name
Owned For
Owner Type
Purchase Details
Closed on
Feb 5, 2022
Sold by
Carroll Anne C and Cappellucci John
Bought by
Carroll Anne C
Current Estimated Value
Purchase Details
Closed on
Oct 6, 2015
Sold by
Cappellucci Anne and Cappellucci John
Bought by
Cappellucci John and Carroll Anne C
Home Financials for this Owner
Home Financials are based on the most recent Mortgage that was taken out on this home.
Original Mortgage
$328,500
Interest Rate
3.95%
Mortgage Type
New Conventional
Purchase Details
Closed on
Aug 18, 2004
Sold by
Brown David L and Brown Gloria Alyce
Bought by
Cappellucci Anne
Create a Home Valuation Report for This Property
The Home Valuation Report is an in-depth analysis detailing your home's value as well as a comparison with similar homes in the area
Home Values in the Area
Average Home Value in this Area
Purchase History
| Date | Buyer | Sale Price | Title Company |
|---|---|---|---|
| Carroll Anne C | -- | None Available | |
| Carroll Anne C | -- | None Available | |
| Cappellucci John | -- | -- | |
| Cappellucci Anne | $552,000 | -- | |
| Cappellucci John | -- | -- | |
| Cappellucci Anne | $552,000 | -- |
Source: Public Records
Mortgage History
| Date | Status | Borrower | Loan Amount |
|---|---|---|---|
| Previous Owner | Cappellucci John | $328,500 | |
| Previous Owner | Cappellucci Anne | $79,000 | |
| Previous Owner | Cappellucci Anne | $287,270 |
Source: Public Records
Tax History Compared to Growth
Tax History
| Year | Tax Paid | Tax Assessment Tax Assessment Total Assessment is a certain percentage of the fair market value that is determined by local assessors to be the total taxable value of land and additions on the property. | Land | Improvement |
|---|---|---|---|---|
| 2025 | $14,044 | $898,500 | $523,400 | $375,100 |
| 2024 | $13,285 | $856,000 | $498,400 | $357,600 |
| 2023 | $12,879 | $773,500 | $453,100 | $320,400 |
| 2022 | $11,619 | $633,200 | $375,300 | $257,900 |
| 2021 | $11,056 | $597,000 | $341,100 | $255,900 |
| 2020 | $10,846 | $610,700 | $341,100 | $269,600 |
| 2019 | $10,716 | $586,200 | $324,900 | $261,300 |
| 2018 | $9,871 | $547,500 | $324,900 | $222,600 |
| 2017 | $9,752 | $537,600 | $315,000 | $222,600 |
| 2016 | $9,214 | $531,400 | $308,800 | $222,600 |
| 2015 | $9,772 | $531,400 | $308,800 | $222,600 |
Source: Public Records
Map
Nearby Homes
- 47 Pequot Rd
- 208 Cochituate Rd
- 37 Pequot Rd
- 260 Cochituate Rd
- 22 Lakeshore Dr
- 7 Shaw Dr
- 353 Old Connecticut Path
- 26 Dudley Rd
- 96 Lakeshore Dr
- 96 Lake Shore Dr
- 15 Crest Rd
- 108 Dudley Rd
- 123 Dudley Rd
- 35 Wallace Rd
- 5 Brook Trail Rd
- 28 Joyce Rd
- 125 Woodridge Rd
- 3 Keith Rd
- 11 White Pine Knoll Rd
- 233 Lakeshore Dr
- 12 Old Farm Rd
- 4 Old Farm Cir
- 13 Old Farm Rd
- 10 Old Farm Rd
- 18 Old Farm Rd
- 17 Old Farm Rd
- 11 Old Farm Rd
- 8 Old Farm Cir
- 3 Old Farm Cir
- 7 Old Farm Cir
- 9 Old Farm Rd
- 8 Old Farm Rd
- 20 Old Farm Rd
- 13 Village Ln Unit 13
- 11 Village Ln Unit 11
- 21 Old Farm Rd
- 7 Old Farm Rd
- 225 Old Connecticut Path
- 14 Rolling Ln
- 10 Old Farm Cir