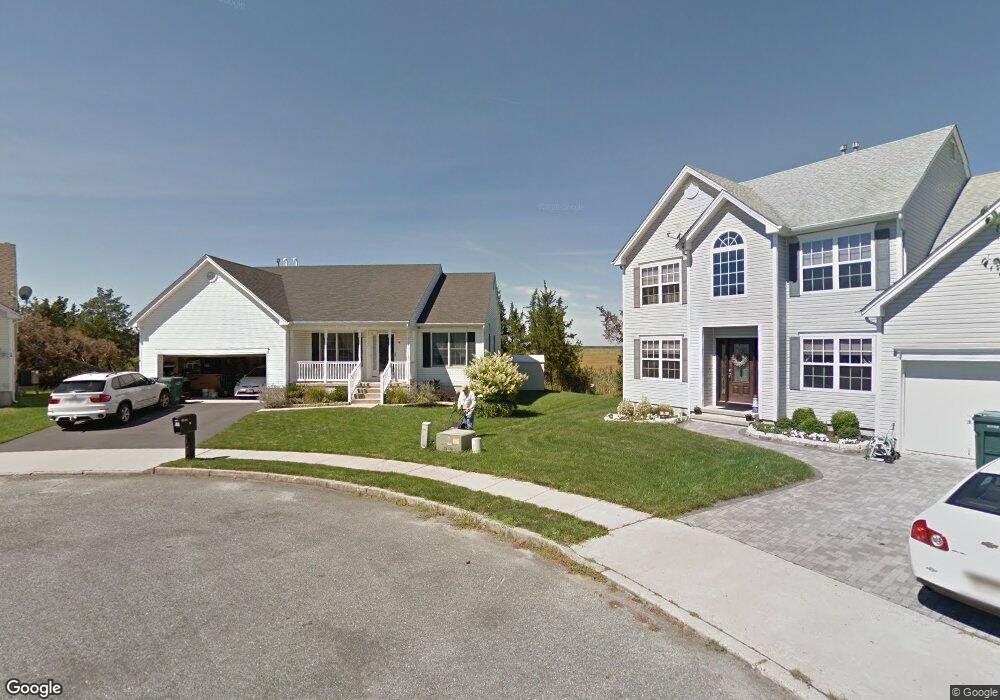
16 Osbourn Ct Tuckerton, NJ 08087
Little Egg Harbor Township NeighborhoodEstimated Value: $450,678 - $537,000
3
Beds
2
Baths
1,711
Sq Ft
$291/Sq Ft
Est. Value
About This Home
This home is located at 16 Osbourn Ct, Tuckerton, NJ 08087 and is currently estimated at $497,670, approximately $290 per square foot. 16 Osbourn Ct is a home located in Ocean County with nearby schools including George J. Mitchell Elementary School, Pinelands Regional Junior High School, and Pinelands Regional High School.
Ownership History
Date
Name
Owned For
Owner Type
Purchase Details
Closed on
Jan 10, 2012
Sold by
Matalog Matalog C and Matalog Marchick, J
Bought by
Marchick John W
Current Estimated Value
Purchase Details
Closed on
Jan 24, 2005
Sold by
Lighthouse Development Co Inc
Bought by
Marchick John W
Home Financials for this Owner
Home Financials are based on the most recent Mortgage that was taken out on this home.
Original Mortgage
$140,000
Interest Rate
5.1%
Mortgage Type
Purchase Money Mortgage
Purchase Details
Closed on
Dec 24, 2003
Sold by
Holohan William
Bought by
Lighthouse Development Company
Create a Home Valuation Report for This Property
The Home Valuation Report is an in-depth analysis detailing your home's value as well as a comparison with similar homes in the area
Home Values in the Area
Average Home Value in this Area
Purchase History
| Date | Buyer | Sale Price | Title Company |
|---|---|---|---|
| Marchick John W | $50,000 | -- | |
| Marchick John W | $279,900 | Fidelity National Title Insu | |
| Lighthouse Development Company | $90,000 | -- |
Source: Public Records
Mortgage History
| Date | Status | Borrower | Loan Amount |
|---|---|---|---|
| Previous Owner | Marchick John W | $140,000 |
Source: Public Records
Tax History Compared to Growth
Tax History
| Year | Tax Paid | Tax Assessment Tax Assessment Total Assessment is a certain percentage of the fair market value that is determined by local assessors to be the total taxable value of land and additions on the property. | Land | Improvement |
|---|---|---|---|---|
| 2025 | $6,425 | $218,100 | $67,000 | $151,100 |
| 2024 | $5,911 | $218,100 | $67,000 | $151,100 |
| 2023 | $5,717 | $218,100 | $67,000 | $151,100 |
| 2022 | $5,967 | $218,100 | $67,000 | $151,100 |
| 2021 | $5,619 | $218,100 | $67,000 | $151,100 |
| 2020 | $5,762 | $218,100 | $67,000 | $151,100 |
| 2019 | $5,562 | $218,100 | $67,000 | $151,100 |
| 2018 | $5,247 | $218,100 | $67,000 | $151,100 |
| 2017 | $5,182 | $218,100 | $67,000 | $151,100 |
| 2016 | $4,965 | $218,100 | $67,000 | $151,100 |
| 2015 | $5,026 | $218,100 | $67,000 | $151,100 |
| 2014 | $3,829 | $213,200 | $66,100 | $147,100 |
Source: Public Records
Map
Nearby Homes
- 4 Kansas Rd
- 16 Beach Dr
- 1298 Radio Rd
- 19 Maryland Rd
- 40 Louisiana Dr
- 52 Ocean Blvd
- 733 Twin Lakes Blvd
- 1427 Radio Rd
- 154 S Longboat Dr
- 7 W Schuylkill Rd
- 103 E Hudson Dr
- 131 S Commodore Dr
- 1159 Radio Rd Unit 7
- 129 S Captains Dr
- 107 E Shrewsbury Dr
- 119 S Captains Dr
- 20 W Navasink Dr
- 34 W Hudson Dr
- 28 W Navasink Dr
- 32 W Navasink Dr