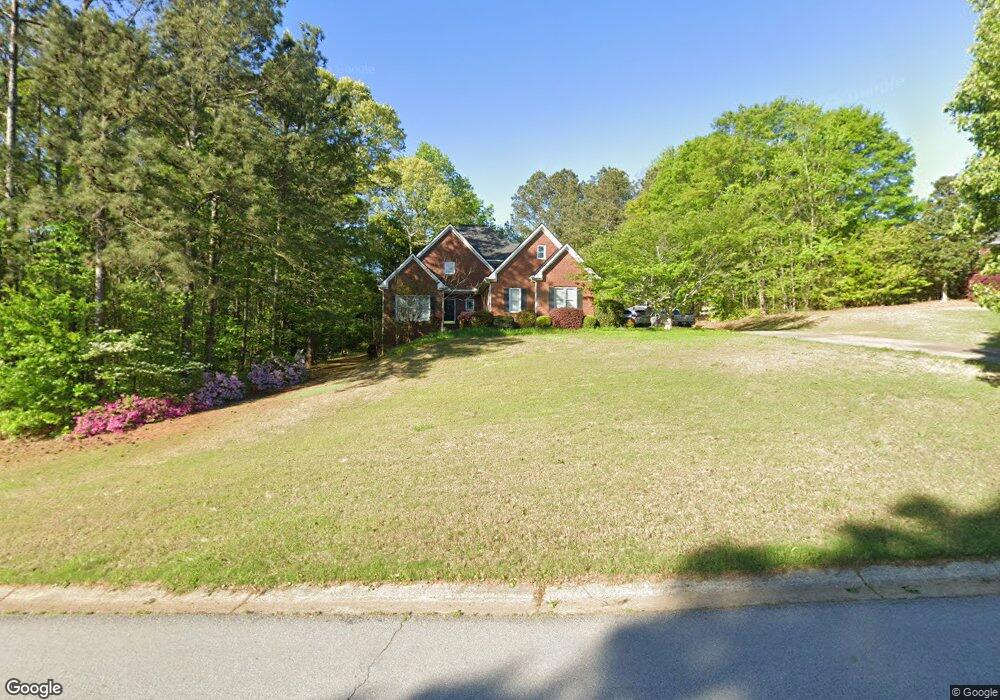
16 Overlook Way Carrollton, GA 30117
Abilene NeighborhoodEstimated Value: $510,037 - $572,000
3
Beds
3
Baths
2,352
Sq Ft
$234/Sq Ft
Est. Value
About This Home
This home is located at 16 Overlook Way, Carrollton, GA 30117 and is currently estimated at $551,009, approximately $234 per square foot. 16 Overlook Way is a home located in Carroll County with nearby schools including Sharp Creek Elementary School, Temple Middle School, and Temple High School.
Ownership History
Date
Name
Owned For
Owner Type
Purchase Details
Closed on
Jan 26, 2007
Sold by
Teal Mark H
Bought by
Moon Kevin D
Current Estimated Value
Home Financials for this Owner
Home Financials are based on the most recent Mortgage that was taken out on this home.
Original Mortgage
$261,250
Outstanding Balance
$156,304
Interest Rate
6.14%
Mortgage Type
New Conventional
Estimated Equity
$394,706
Purchase Details
Closed on
Feb 12, 2002
Sold by
Teal Mark and Teal Christi
Bought by
Teal Mark H and Teal Christi B
Purchase Details
Closed on
Jan 19, 1999
Sold by
Hms Development Inc
Bought by
Teal Mark and Teal Christi
Purchase Details
Closed on
Dec 2, 1998
Sold by
Hms Development Inc
Bought by
Hms Development Inc
Purchase Details
Closed on
Dec 1, 1995
Sold by
Shadrix R Etal
Bought by
Hms Development Inc
Purchase Details
Closed on
Jun 1, 1995
Bought by
Shadrix Shadrix H and Shadrix Mattie
Purchase Details
Closed on
Jan 9, 1995
Sold by
Teal Mark H and Teal Christi B
Bought by
Teal Mark H and Teal Christi B
Create a Home Valuation Report for This Property
The Home Valuation Report is an in-depth analysis detailing your home's value as well as a comparison with similar homes in the area
Home Values in the Area
Average Home Value in this Area
Purchase History
| Date | Buyer | Sale Price | Title Company |
|---|---|---|---|
| Moon Kevin D | $275,000 | -- | |
| Teal Mark H | -- | -- | |
| Teal Mark | $23,500 | -- | |
| Hms Development Inc | -- | -- | |
| Hms Development Inc | $530,000 | -- | |
| Shadrix R Etal | -- | -- | |
| Shadrix Shadrix H | -- | -- | |
| Teal Mark H | -- | -- |
Source: Public Records
Mortgage History
| Date | Status | Borrower | Loan Amount |
|---|---|---|---|
| Open | Moon Kevin D | $261,250 |
Source: Public Records
Tax History Compared to Growth
Tax History
| Year | Tax Paid | Tax Assessment Tax Assessment Total Assessment is a certain percentage of the fair market value that is determined by local assessors to be the total taxable value of land and additions on the property. | Land | Improvement |
|---|---|---|---|---|
| 2024 | $3,975 | $214,291 | $8,000 | $206,291 |
| 2023 | $3,975 | $195,268 | $8,000 | $187,268 |
| 2022 | $3,363 | $158,360 | $8,000 | $150,360 |
| 2021 | $3,051 | $136,482 | $8,000 | $128,482 |
| 2020 | $2,782 | $121,355 | $8,000 | $113,355 |
| 2019 | $2,624 | $111,570 | $8,000 | $103,570 |
| 2018 | $2,453 | $100,238 | $8,000 | $92,238 |
| 2017 | $2,460 | $100,238 | $8,000 | $92,238 |
| 2016 | $2,461 | $100,238 | $8,000 | $92,238 |
| 2015 | $2,358 | $88,334 | $10,000 | $78,334 |
| 2014 | $2,368 | $88,334 | $10,000 | $78,334 |
Source: Public Records
Map
Nearby Homes
- 0 Old Center Point Rd Unit 10576496
- 0 Old Center Point Rd Unit 147359
- 2930 Hog Liver Rd
- 25 Adalee Rd
- 183 Muse Bridge Rd
- 2519 Hog Liver Rd
- 1015 Mote Rd
- 3279 Shady Grove Rd
- 446 McGukin Rd
- 138 Zachary Dr
- 59 Tulip Way
- 549 McGukin Rd
- 177 Garnett Point Dr
- 255 Emerald Pointe Dr
- 10 Deerfield Ln
- 0 Shady Grove Rd Unit 10601173
- 0 Shady Grove Rd Unit 10601172
- 2020 Carrollton Hwy
- 45 Buell Jones Rd
- 101 Country Ln
- 9 Overlook Way
- 34 Overlook Way
- 78 Country Ln
- 35 Overlook Way
- 54 Country Ln
- 125 Country Ln
- 92 Country Ln
- 54 Overlook Way
- 57 Overlook Way
- 153 Country Ln
- 112 Country Ln
- 104 Country Ln
- 104 Country Ln
- 126 Country Ln
- 0 Country Ln Unit 3267617
- 0 Country Ln Unit 8609848
- 0 Country Ln
- 11 Lakeside Cove
- 71 Overlook Way