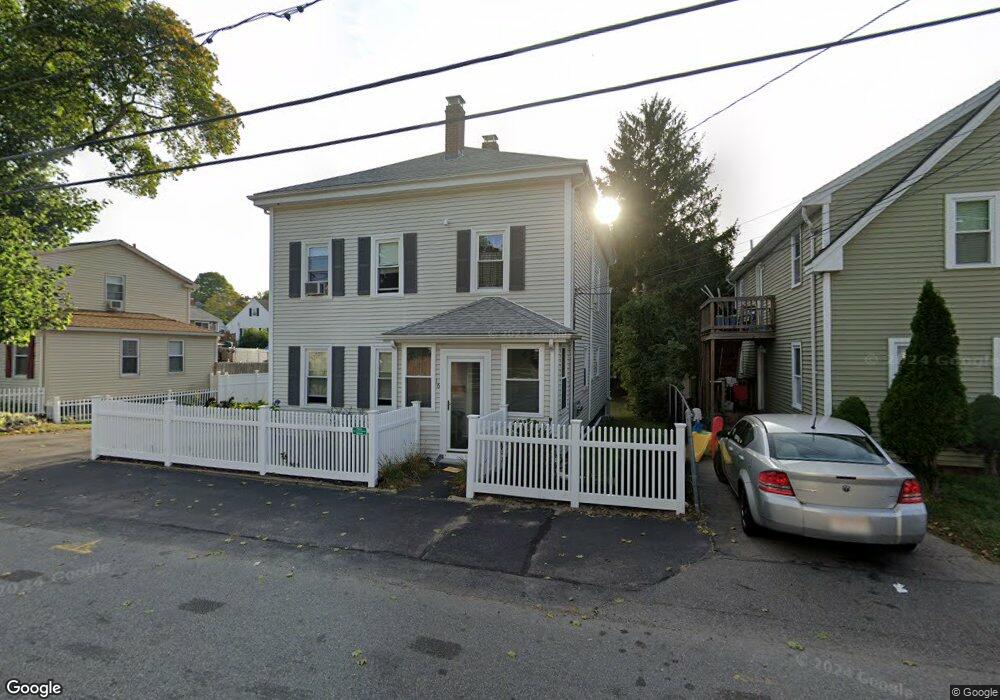
16 Parker St Brockton, MA 02302
Estimated Value: $593,561 - $687,000
5
Beds
2
Baths
1,924
Sq Ft
$334/Sq Ft
Est. Value
About This Home
This home is located at 16 Parker St, Brockton, MA 02302 and is currently estimated at $642,890, approximately $334 per square foot. 16 Parker St is a home located in Plymouth County with nearby schools including Arnone Elementary School, Joseph F. Plouffe Middle School, and Brockton Area Seventh-Day Adventist Academy.
Ownership History
Date
Name
Owned For
Owner Type
Purchase Details
Closed on
May 13, 1996
Sold by
Beckwith Peter W
Bought by
Willis James B
Current Estimated Value
Home Financials for this Owner
Home Financials are based on the most recent Mortgage that was taken out on this home.
Original Mortgage
$61,750
Interest Rate
7.67%
Mortgage Type
Purchase Money Mortgage
Create a Home Valuation Report for This Property
The Home Valuation Report is an in-depth analysis detailing your home's value as well as a comparison with similar homes in the area
Home Values in the Area
Average Home Value in this Area
Purchase History
| Date | Buyer | Sale Price | Title Company |
|---|---|---|---|
| Willis James B | $65,000 | -- |
Source: Public Records
Mortgage History
| Date | Status | Borrower | Loan Amount |
|---|---|---|---|
| Open | Willis James B | $155,000 | |
| Closed | Willis James B | $134,900 | |
| Closed | Willis James B | $75,000 | |
| Closed | Willis James B | $61,750 |
Source: Public Records
Tax History Compared to Growth
Tax History
| Year | Tax Paid | Tax Assessment Tax Assessment Total Assessment is a certain percentage of the fair market value that is determined by local assessors to be the total taxable value of land and additions on the property. | Land | Improvement |
|---|---|---|---|---|
| 2025 | $6,420 | $530,100 | $140,200 | $389,900 |
| 2024 | $6,154 | $512,000 | $140,200 | $371,800 |
| 2023 | $6,142 | $473,200 | $105,000 | $368,200 |
| 2022 | $6,029 | $431,600 | $95,400 | $336,200 |
| 2021 | $5,430 | $374,500 | $79,400 | $295,100 |
| 2020 | $4,315 | $284,800 | $74,200 | $210,600 |
| 2019 | $4,859 | $312,700 | $72,400 | $240,300 |
| 2018 | $4,188 | $260,800 | $72,400 | $188,400 |
| 2017 | $4,038 | $250,800 | $72,400 | $178,400 |
| 2016 | $3,903 | $224,800 | $70,200 | $154,600 |
| 2015 | $3,443 | $189,700 | $70,200 | $119,500 |
| 2014 | $3,160 | $174,300 | $70,200 | $104,100 |
Source: Public Records
Map
Nearby Homes