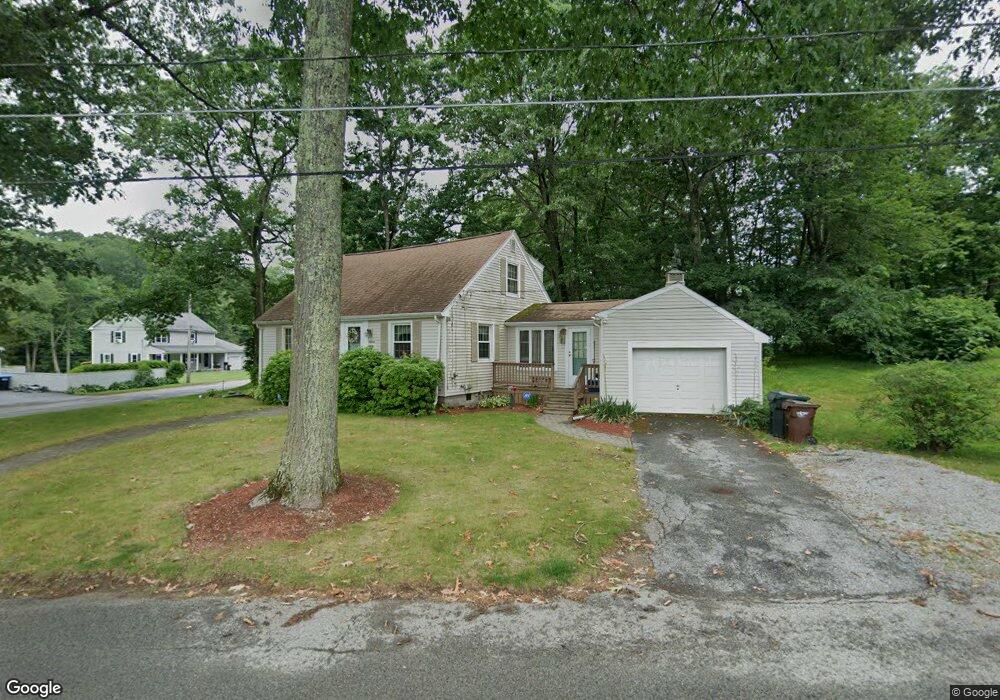
16 Paul St Auburn, MA 01501
Downtown Auburn NeighborhoodEstimated Value: $476,000 - $536,000
3
Beds
2
Baths
1,647
Sq Ft
$306/Sq Ft
Est. Value
About This Home
This home is located at 16 Paul St, Auburn, MA 01501 and is currently estimated at $504,722, approximately $306 per square foot. 16 Paul St is a home located in Worcester County with nearby schools including Auburn Senior High School and Shrewsbury Montessori School - Auburn Campus.
Ownership History
Date
Name
Owned For
Owner Type
Purchase Details
Closed on
Jul 7, 2020
Sold by
Grossman Robert D and Grossman Heather S
Bought by
R D & H S Grossman Ret
Current Estimated Value
Purchase Details
Closed on
Aug 10, 1971
Bought by
Grossman Robert D
Create a Home Valuation Report for This Property
The Home Valuation Report is an in-depth analysis detailing your home's value as well as a comparison with similar homes in the area
Home Values in the Area
Average Home Value in this Area
Purchase History
| Date | Buyer | Sale Price | Title Company |
|---|---|---|---|
| R D & H S Grossman Ret | -- | None Available | |
| Grossman Robert D | -- | -- |
Source: Public Records
Mortgage History
| Date | Status | Borrower | Loan Amount |
|---|---|---|---|
| Previous Owner | Grossman Robert D | $104,890 | |
| Previous Owner | Grossman Robert D | $130,000 | |
| Previous Owner | Grossman Robert D | $90,000 |
Source: Public Records
Tax History Compared to Growth
Tax History
| Year | Tax Paid | Tax Assessment Tax Assessment Total Assessment is a certain percentage of the fair market value that is determined by local assessors to be the total taxable value of land and additions on the property. | Land | Improvement |
|---|---|---|---|---|
| 2025 | $63 | $442,900 | $138,500 | $304,400 |
| 2024 | $6,577 | $440,500 | $132,300 | $308,200 |
| 2023 | $6,466 | $407,200 | $120,200 | $287,000 |
| 2022 | $5,995 | $356,400 | $120,200 | $236,200 |
| 2021 | $5,681 | $313,200 | $106,100 | $207,100 |
| 2020 | $5,482 | $304,900 | $106,100 | $198,800 |
| 2019 | $5,362 | $291,100 | $105,100 | $186,000 |
| 2018 | $5,193 | $281,600 | $98,300 | $183,300 |
| 2017 | $4,469 | $243,700 | $89,100 | $154,600 |
| 2016 | $4,159 | $229,900 | $93,000 | $136,900 |
| 2015 | $3,821 | $221,400 | $93,000 | $128,400 |
| 2014 | $3,731 | $215,800 | $88,500 | $127,300 |
Source: Public Records
Map
Nearby Homes