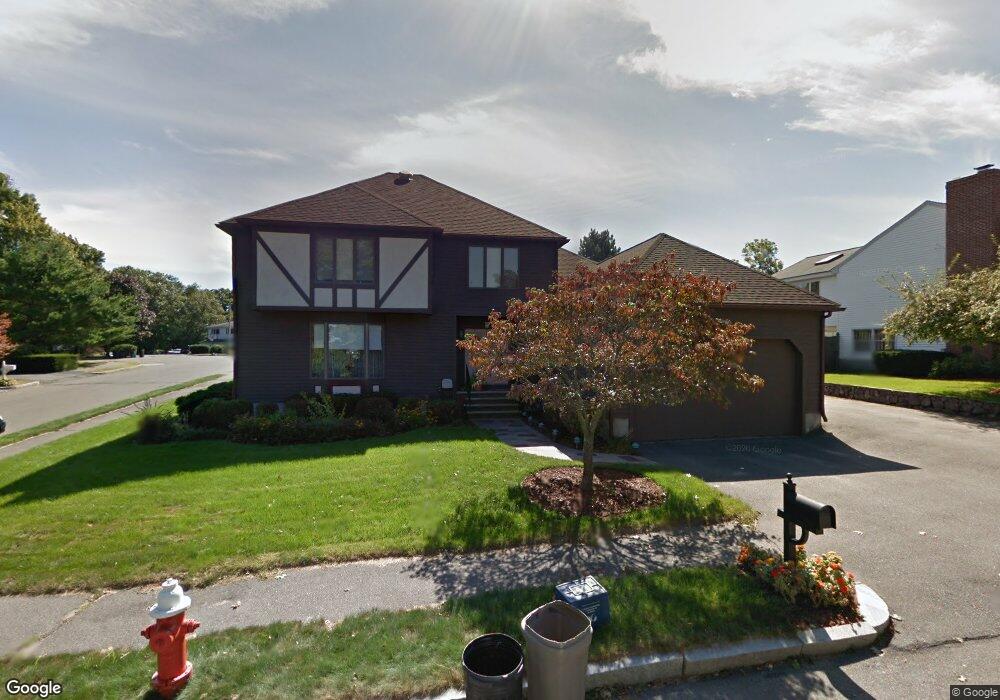
16 Pebble Place Stoneham, MA 02180
Colonial Park NeighborhoodEstimated Value: $1,046,460 - $1,205,000
3
Beds
3
Baths
2,652
Sq Ft
$420/Sq Ft
Est. Value
About This Home
This home is located at 16 Pebble Place, Stoneham, MA 02180 and is currently estimated at $1,115,115, approximately $420 per square foot. 16 Pebble Place is a home located in Middlesex County with nearby schools including Stoneham High School, St. Patrick Elementary School, and Greater Boston Academy.
Ownership History
Date
Name
Owned For
Owner Type
Purchase Details
Closed on
Jan 31, 2024
Sold by
Banks Bernard and Banks Elaine M
Bought by
Banks Ft and Bank
Current Estimated Value
Purchase Details
Closed on
Nov 12, 1981
Bought by
Banks Bernard and Banks Elaine M
Create a Home Valuation Report for This Property
The Home Valuation Report is an in-depth analysis detailing your home's value as well as a comparison with similar homes in the area
Home Values in the Area
Average Home Value in this Area
Purchase History
| Date | Buyer | Sale Price | Title Company |
|---|---|---|---|
| Banks Ft | -- | None Available | |
| Banks Bernard | -- | -- |
Source: Public Records
Mortgage History
| Date | Status | Borrower | Loan Amount |
|---|---|---|---|
| Previous Owner | Banks Bernard | $50,000 |
Source: Public Records
Tax History Compared to Growth
Tax History
| Year | Tax Paid | Tax Assessment Tax Assessment Total Assessment is a certain percentage of the fair market value that is determined by local assessors to be the total taxable value of land and additions on the property. | Land | Improvement |
|---|---|---|---|---|
| 2025 | $9,317 | $910,800 | $380,000 | $530,800 |
| 2024 | $8,931 | $843,300 | $351,500 | $491,800 |
| 2023 | $8,695 | $783,300 | $323,000 | $460,300 |
| 2022 | $7,676 | $737,400 | $304,000 | $433,400 |
| 2021 | $7,716 | $713,100 | $285,000 | $428,100 |
| 2020 | $7,652 | $709,200 | $285,000 | $424,200 |
| 2019 | $7,556 | $673,400 | $256,500 | $416,900 |
| 2018 | $7,348 | $627,500 | $237,500 | $390,000 |
| 2017 | $7,537 | $608,300 | $228,000 | $380,300 |
| 2016 | $7,220 | $568,500 | $218,500 | $350,000 |
| 2015 | $7,224 | $557,400 | $218,500 | $338,900 |
| 2014 | $7,197 | $533,500 | $209,000 | $324,500 |
Source: Public Records
Map
Nearby Homes
- 14 Dinanno Rd
- 39 Tamarock Terrace
- 6 Gavin Cir
- 4 Gavin Cir
- 1 Ludlow Ave
- 81 Spring St
- 6 Lovis Ave
- 159 Franklin St Unit C2
- 9 Lovis Ave
- 17 Franklin St
- 137 Franklin St Unit 102
- 137 Franklin St Unit 404
- 61 Forest St
- 5 Sheffield Rd
- 20 Myrtle St
- 3 Hickory Hill Rd Unit 1
- 24 Myrtle Ave
- 13 Washington Ave
- 59 Norval Ave
- 569 Franklin St Unit 1