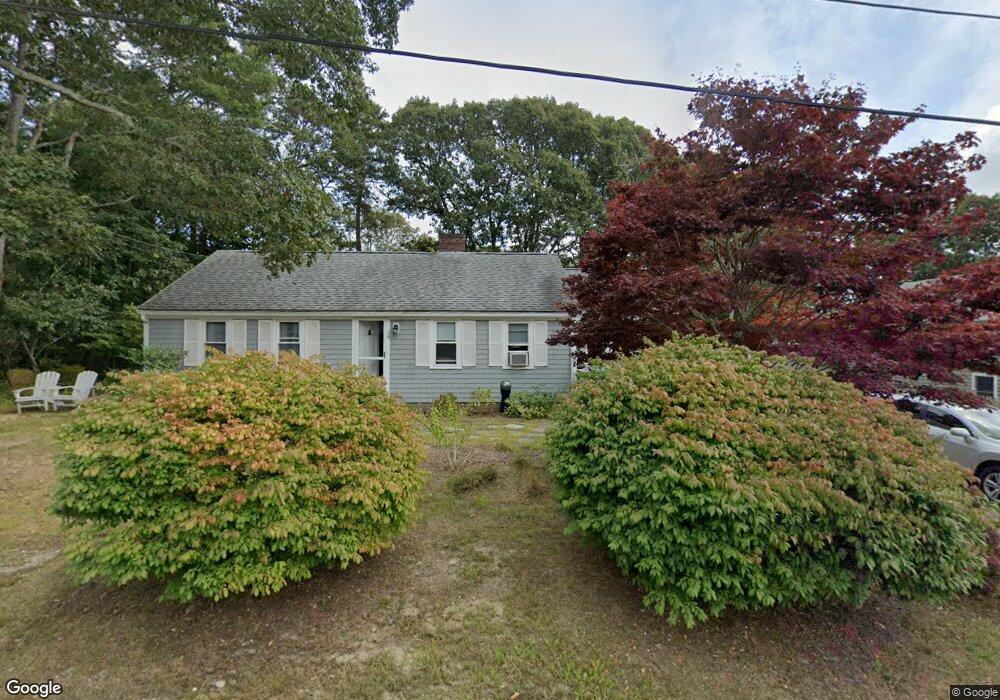
16 Peter Oliver Rd South Dennis, MA 02660
South Dennis NeighborhoodEstimated Value: $458,000 - $513,000
2
Beds
1
Bath
1,100
Sq Ft
$450/Sq Ft
Est. Value
About This Home
This home is located at 16 Peter Oliver Rd, South Dennis, MA 02660 and is currently estimated at $494,938, approximately $449 per square foot. 16 Peter Oliver Rd is a home located in Barnstable County with nearby schools including Dennis-Yarmouth Regional High School and St. Pius X. School.
Ownership History
Date
Name
Owned For
Owner Type
Purchase Details
Closed on
Nov 26, 2018
Sold by
Bator Shirley A
Bought by
Shirley A Bator T
Current Estimated Value
Purchase Details
Closed on
Apr 30, 1998
Sold by
Netto John T and Netto Virginia G
Bought by
Bator Edward P and Bator Shirley A
Home Financials for this Owner
Home Financials are based on the most recent Mortgage that was taken out on this home.
Original Mortgage
$45,000
Interest Rate
7.04%
Mortgage Type
Purchase Money Mortgage
Create a Home Valuation Report for This Property
The Home Valuation Report is an in-depth analysis detailing your home's value as well as a comparison with similar homes in the area
Home Values in the Area
Average Home Value in this Area
Purchase History
| Date | Buyer | Sale Price | Title Company |
|---|---|---|---|
| Shirley A Bator T | -- | None Available | |
| Bator Edward P | $89,000 | -- |
Source: Public Records
Mortgage History
| Date | Status | Borrower | Loan Amount |
|---|---|---|---|
| Previous Owner | Bator Edward P | $45,000 |
Source: Public Records
Tax History Compared to Growth
Tax History
| Year | Tax Paid | Tax Assessment Tax Assessment Total Assessment is a certain percentage of the fair market value that is determined by local assessors to be the total taxable value of land and additions on the property. | Land | Improvement |
|---|---|---|---|---|
| 2025 | $1,914 | $442,100 | $127,800 | $314,300 |
| 2024 | $1,774 | $404,200 | $122,900 | $281,300 |
| 2023 | $1,721 | $368,500 | $111,700 | $256,800 |
| 2022 | $1,679 | $299,800 | $111,800 | $188,000 |
| 2021 | $1,594 | $264,300 | $109,600 | $154,700 |
| 2020 | $1,524 | $249,900 | $109,600 | $140,300 |
| 2019 | $1,497 | $242,700 | $118,200 | $124,500 |
| 2018 | $1,357 | $214,000 | $102,300 | $111,700 |
| 2017 | $1,294 | $210,400 | $102,300 | $108,100 |
| 2016 | $1,298 | $198,800 | $107,400 | $91,400 |
| 2015 | $1,272 | $198,800 | $107,400 | $91,400 |
| 2014 | $1,165 | $183,500 | $92,100 | $91,400 |
Source: Public Records
Map
Nearby Homes
- 26 Olivia Walker Way
- 153 Bayridge Dr
- 4 Ebb Rd
- 11 Uncle Stanleys Way
- 17 Margate Ln
- 15 Captain Jud Rd
- 118 Driftwood Ln
- 129 Driftwood Ln
- 17 Fairmount Rd
- 13 Covey Dr
- 17 Fairmount Rd
- 111 Merchant Ave
- 10 Joanne Dr
- 7 Vinland Dr
- 25 Skerry Rd
- 1 Norseman Dr
- 4 Old Colony Way
- 6 Nimble Hill Dr
- 62 Old Fish House Rd
- 6 Hawthorn St
- 20 Peter Oliver Rd
- 12 Peter Oliver Rd
- 19 Norse Rd
- 17 Norse Rd
- 23 Norse Rd
- 9 Peter Oliver Rd
- 13 Peter Oliver Rd
- 22 Peter Oliver Rd
- 8 Peter Oliver Rd
- 13 Norse Rd
- 5 Peter Oliver Rd
- 15 Peter Oliver Rd
- 24 Norse Rd
- 94 Alfred Metcalf Dr
- 26 Norse Rd
- 9 Norse Rd
- 20 Norse Rd
- 98 Alfred Metcalf Dr
- 1 Peter Oliver Rd
- 4 Peter Oliver Rd